


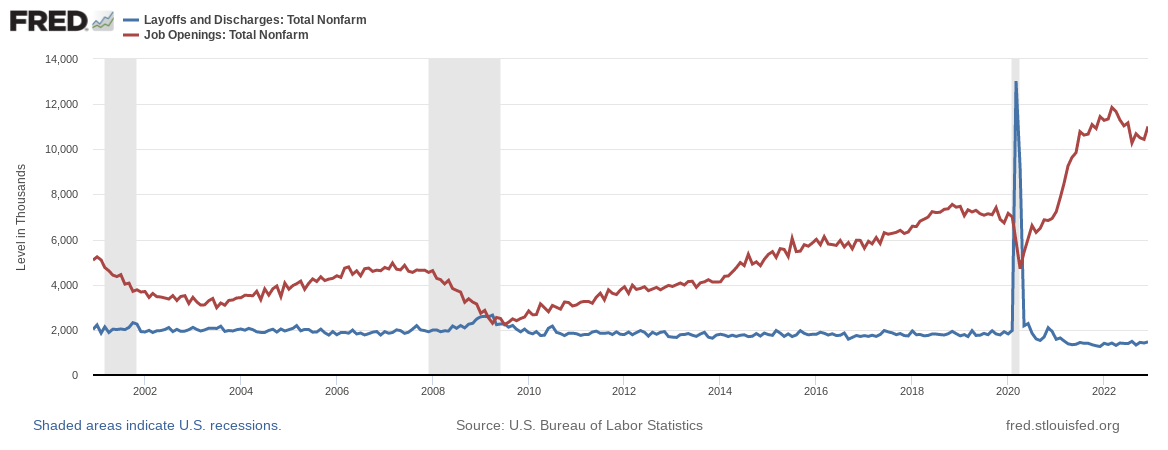
7.5 jobs for every laid off worker
Despite the attention-grabbing headlines, layoffs are still about 25% below pre-pandemic levels, and for every job lost there are a record 7.5 waiting to be filled.
Comparing the red line (job openings) to the blue line (layoffs and discharges) it’s apparent the gap has grown consistently over the past decade. While there’s more to the story - this doesn’t speak to the quality of employment, wages, etc. - one can’t help but wonder if a shrinking labor participation rate is worsening an American labor shortage. Also, is the gap worsened because the price of labor isn’t keeping up with demand. Supply and demand meet at a certain price point, and if prices are held artificially low shortages occur.
Exacerbating the issue, today nonfarm payrolls data was released and it almost tripled expectations. Also released today, ISM Services PMI also came in significantly higher than expected, at an expansionary 55.2.

Services is the last remaining inflationary pillar. Does this kill the pivot narrative? Maybe not, according to David Kelly, Chief Global Strategist, JP Morgan Asset Management:
"The Fed should be cheered by the continued strength in job growth without rising wage inflation, but continued labor market tightness may also give them confidence that they can keep policy tighter for longer. While bond yields pushed higher following this morning’s release, we still think it’s an open question as to whether the Fed raises rates for a third time this year in May. With inflation coming down and aggregate demand cooling across the economy, the Fed would be wise to exercise patience and assess the lagged impact of the enormous monetary tightening already done. If subsequent jobs and inflation reports continue to reflect this cooling, hopes of a Fed pause after March may not be dashed."