

11 Market Charts: Dividend Drawdown, V-Shapes, And More
Here are the top investing and economics charts and graphs from the previous week:
Market recovery of 2020 losses

V-shaped economic recovery in China

Former luxury brand consumers are now looking for a good bargain

Tourism contributed $1.8 trillion to the US economy in 2019, 8.6% of GDP

Spending at Big box stores doing alright

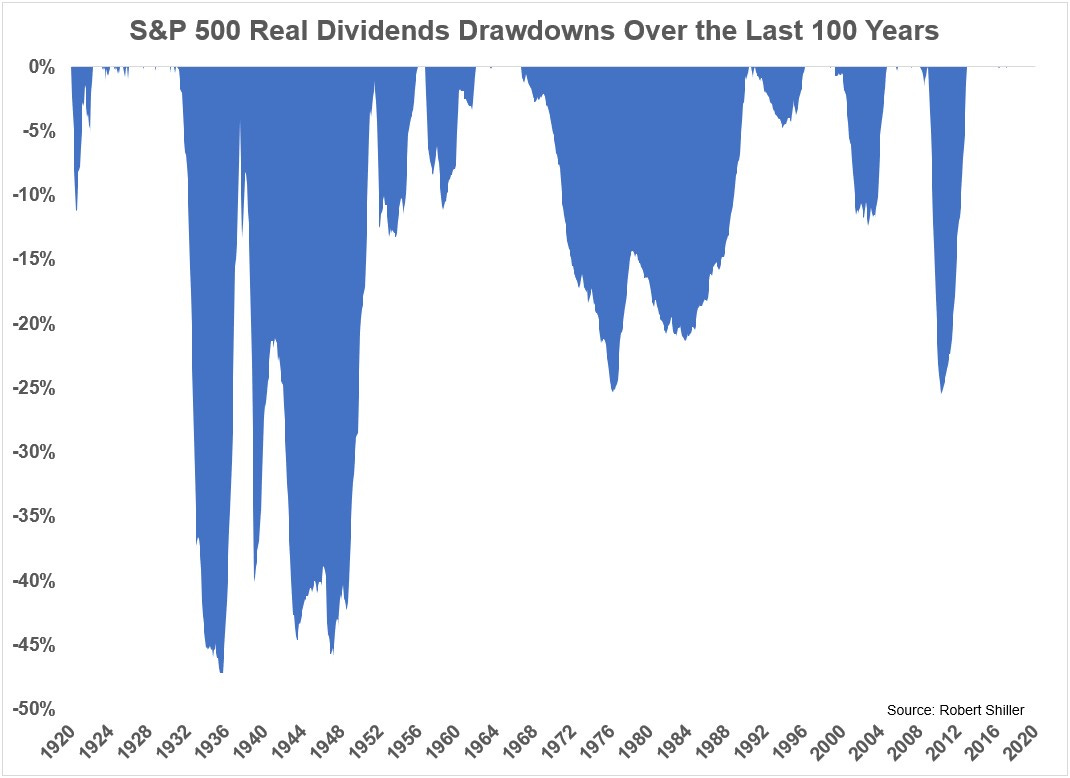
Dividend drawdowns throughout the past century
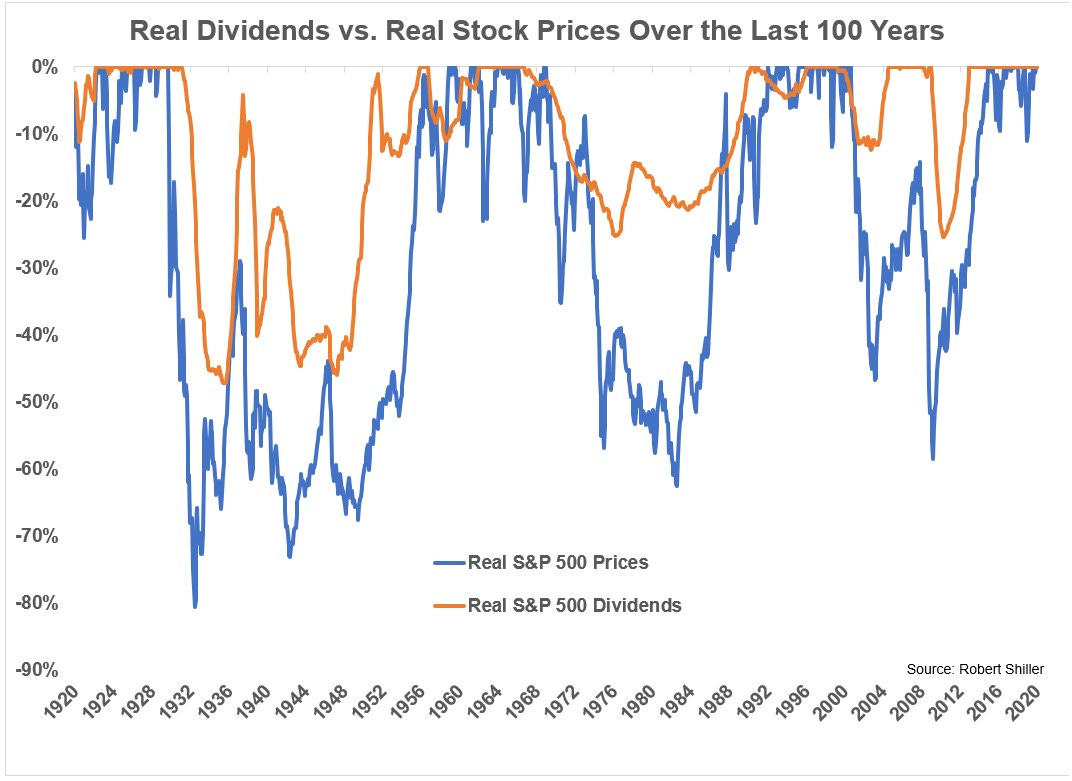
Dividend drawdowns correlated to stock price declines, but not a 1 for 1 relationship
Covid-19 was the 3rd leading cause of death in the US between February and May

Personal savings rate hits record high of 33%

Unemployment picture in the US starting to improve, believe it or not

Beer and wine sales skyrocketing in Canada
