Asset Returns After Fed Hike Cycle Ends
1: Only in the world of investing can professional opinions be so far apart.
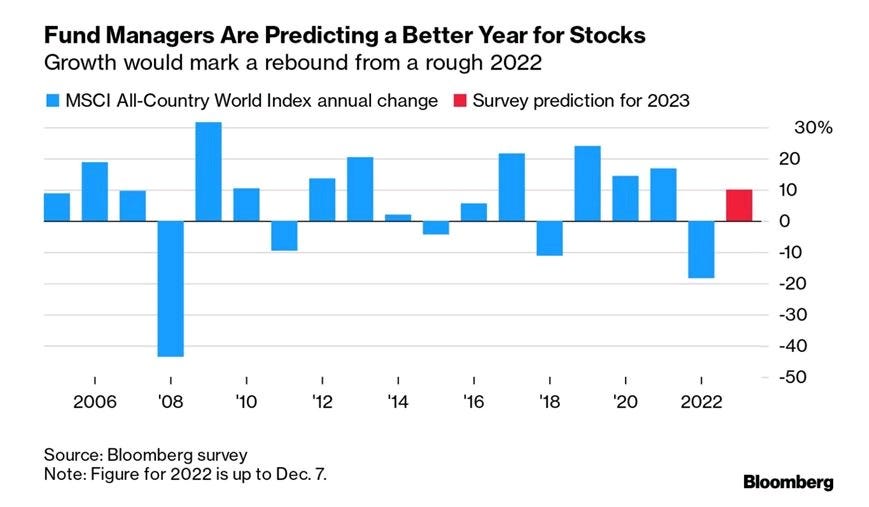
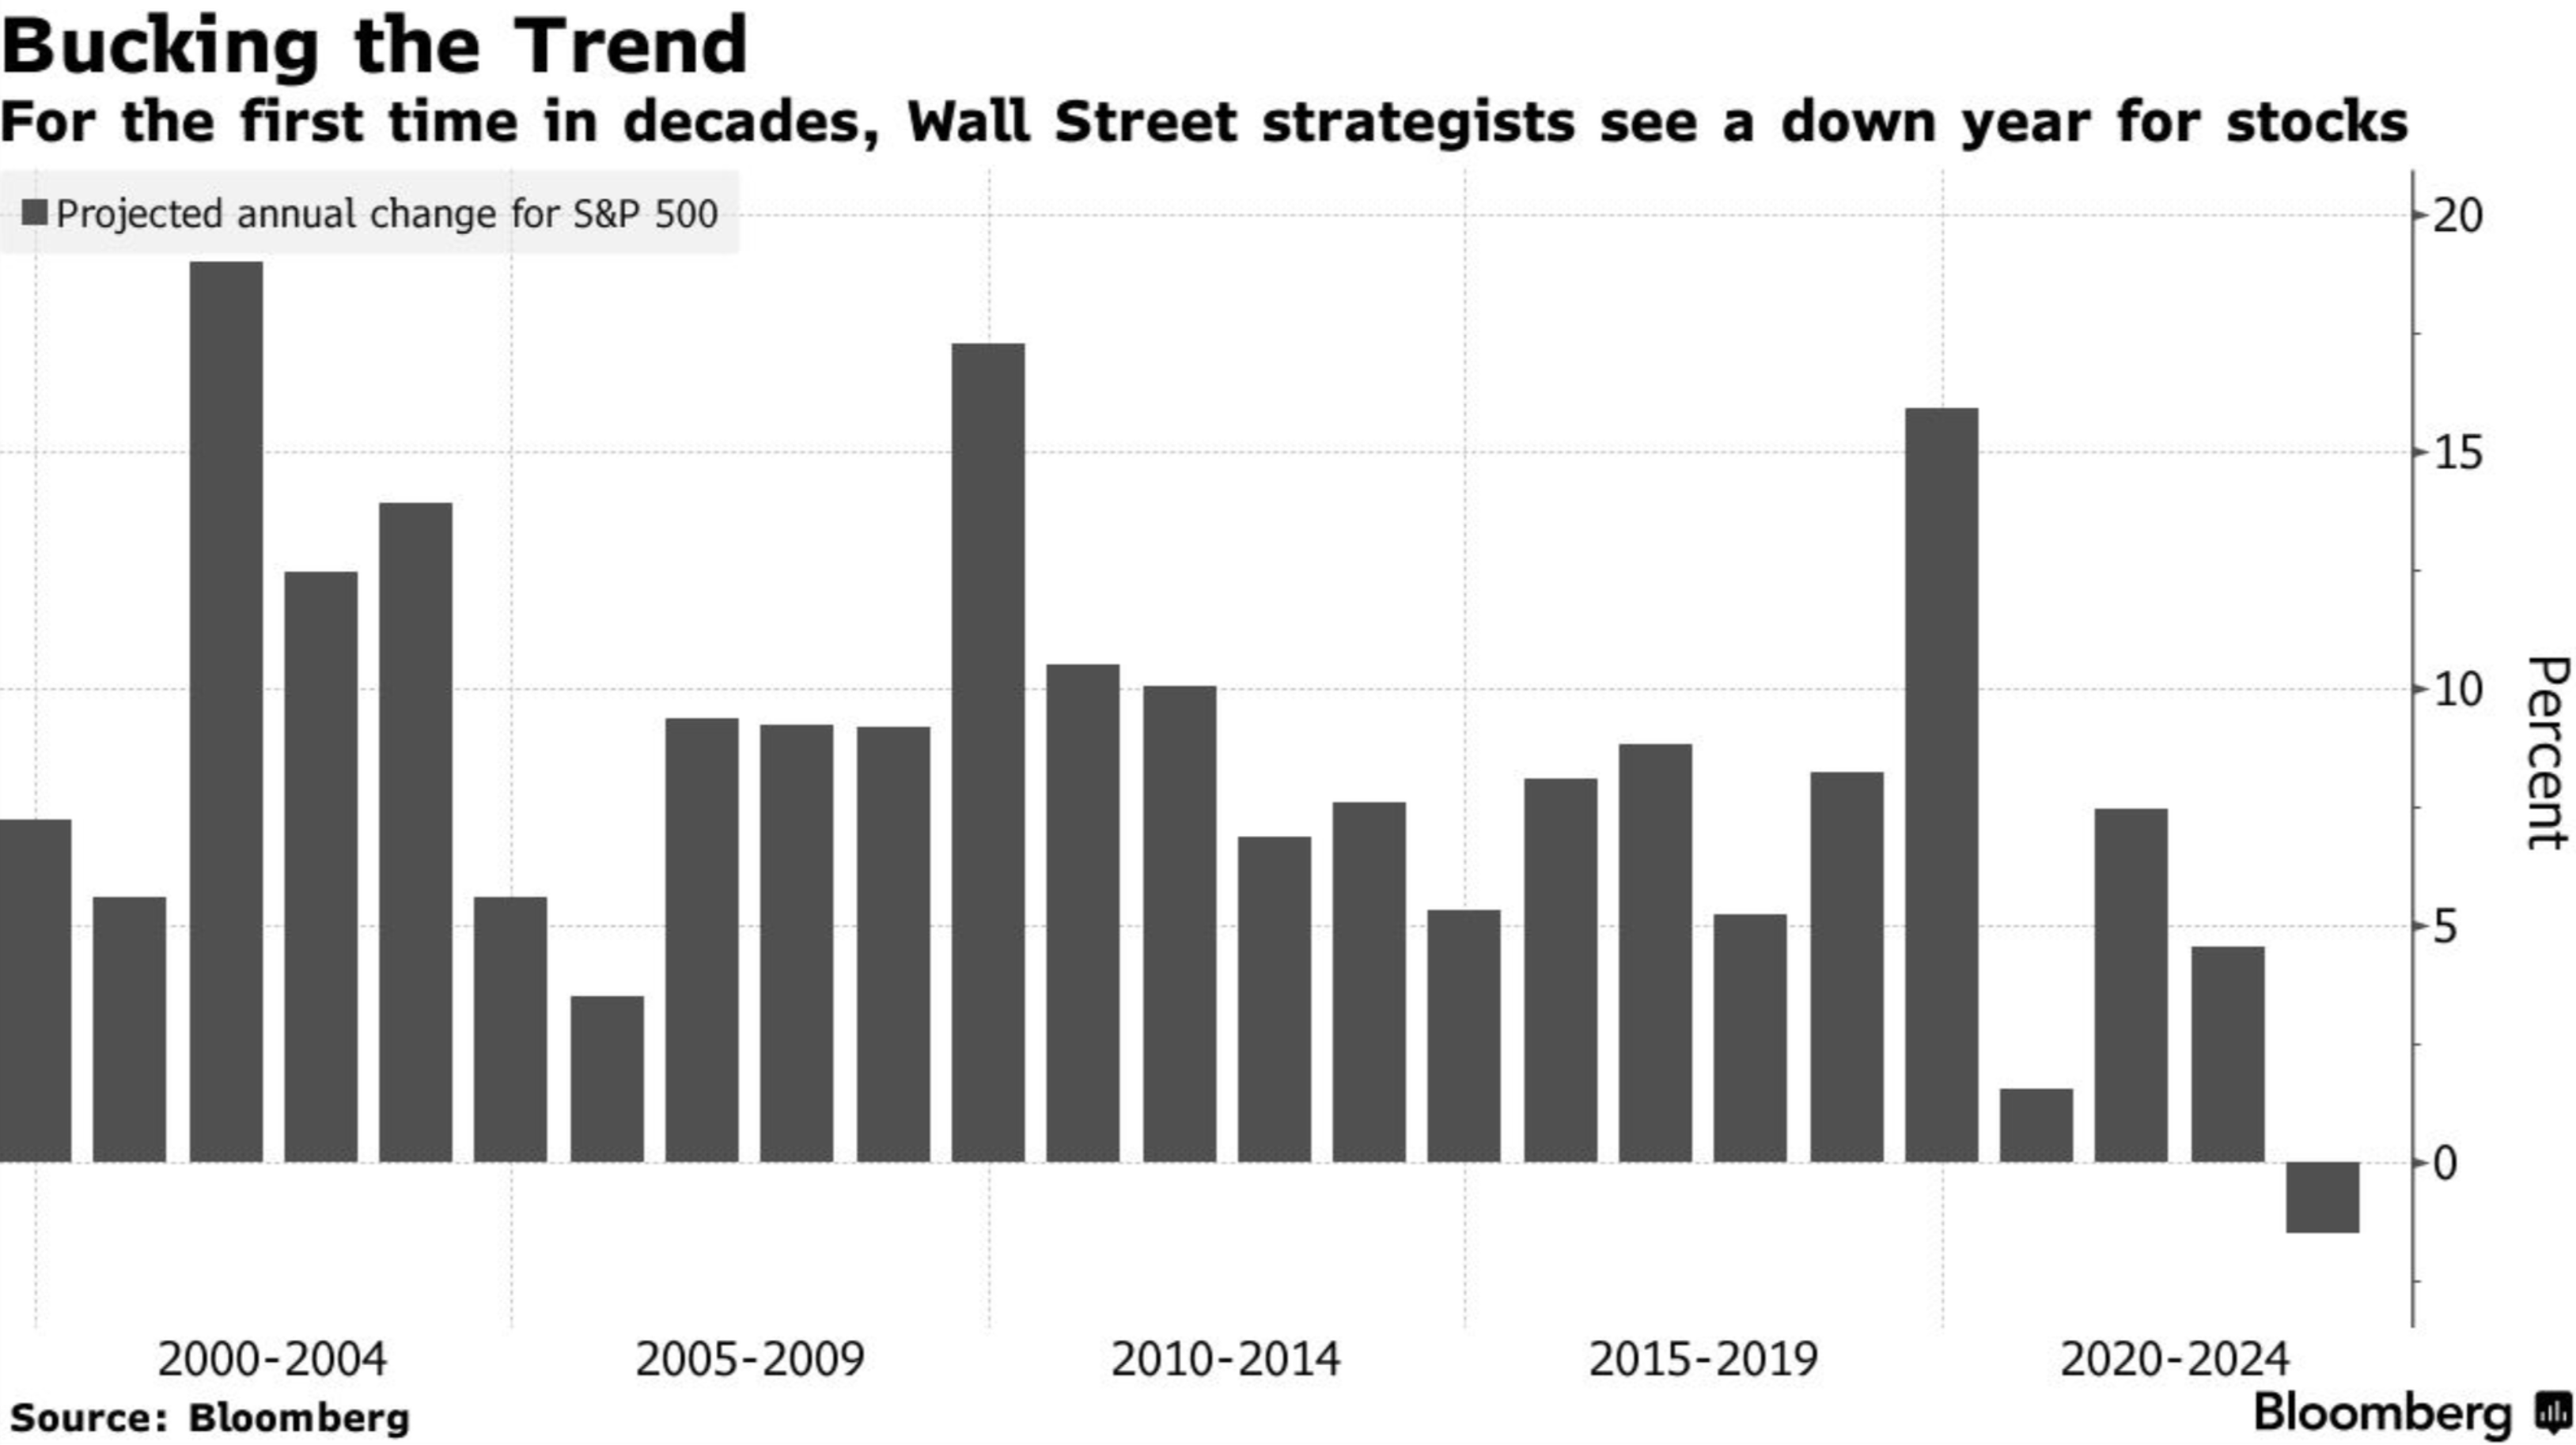
The first chart below shows that fund managers are predicting a positive year for stocks in 2023. The second chart shows that investment strategists foresee another negative year.
What gives?
This is what I love and hate about investing. It’s forever a mystery. Every day I’m trying to process the same information as the rest of the world, but my conclusions can differ remarkably from others.
How does one beat the market then? Firstly, I think investors can beat their peers by removing emotions from their decision-making, owning productive assets (as opposed to blowing money on frivolous consumption) and budgeting risk appropriately. Secondly, I think investors can outperform by making big moves on those rare occasions the market is clearly disconnected from reality. Generally, I need to be more right than the rest of the crowd, and it’s easier to be ‘more right’ when the strength of the crowd’s conviction is clear.
Given the conflicting information in the charts below, there doesn’t seem to be much conviction right now.
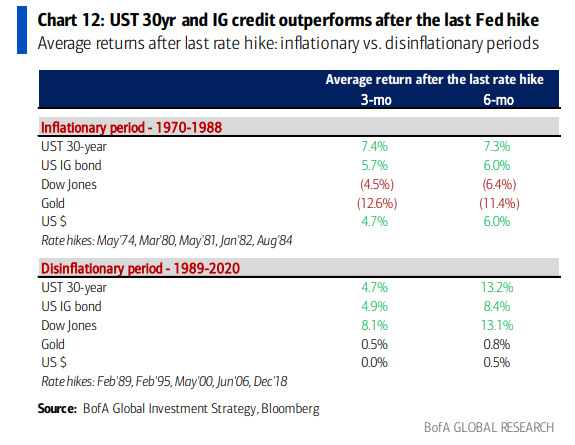
2: It is widely expected the Fed is near the peak of its hiking cycle. What happens to assets after that point depends on the prevailing economic environment, according to the tables below.
As you can see, after the Fed makes its last hike, market performance tends to be much stronger during disinflationary periods.

3: How long will the current environment remain inflationary?
That’s the first million dollar question the markets are struggling to answer. (The second million dollar question is how far will economic output and employment follow inflation downward?)
I’m increasingly convinced that by mid-2023 year-over-year CPI prints will be much lower than today. (My best guess based on monthly headline inflation data since the summer is roughly 3.5%.)
Today, the Bureau of Labor Statistics announced the year-over-year change in headline CPI for November was 7.1% and month-over-month change in CPI was 0.1%. A crude extrapolation of that single monthly data point implies a forward 1.2% annualized rate, assuming (unrealistically) that month-over-month price changes remain the same. Even if month-over-month price changes were three times higher than in November, the forward annualized change in CPI would be 3.65% - considerably lower than the past 12 months.
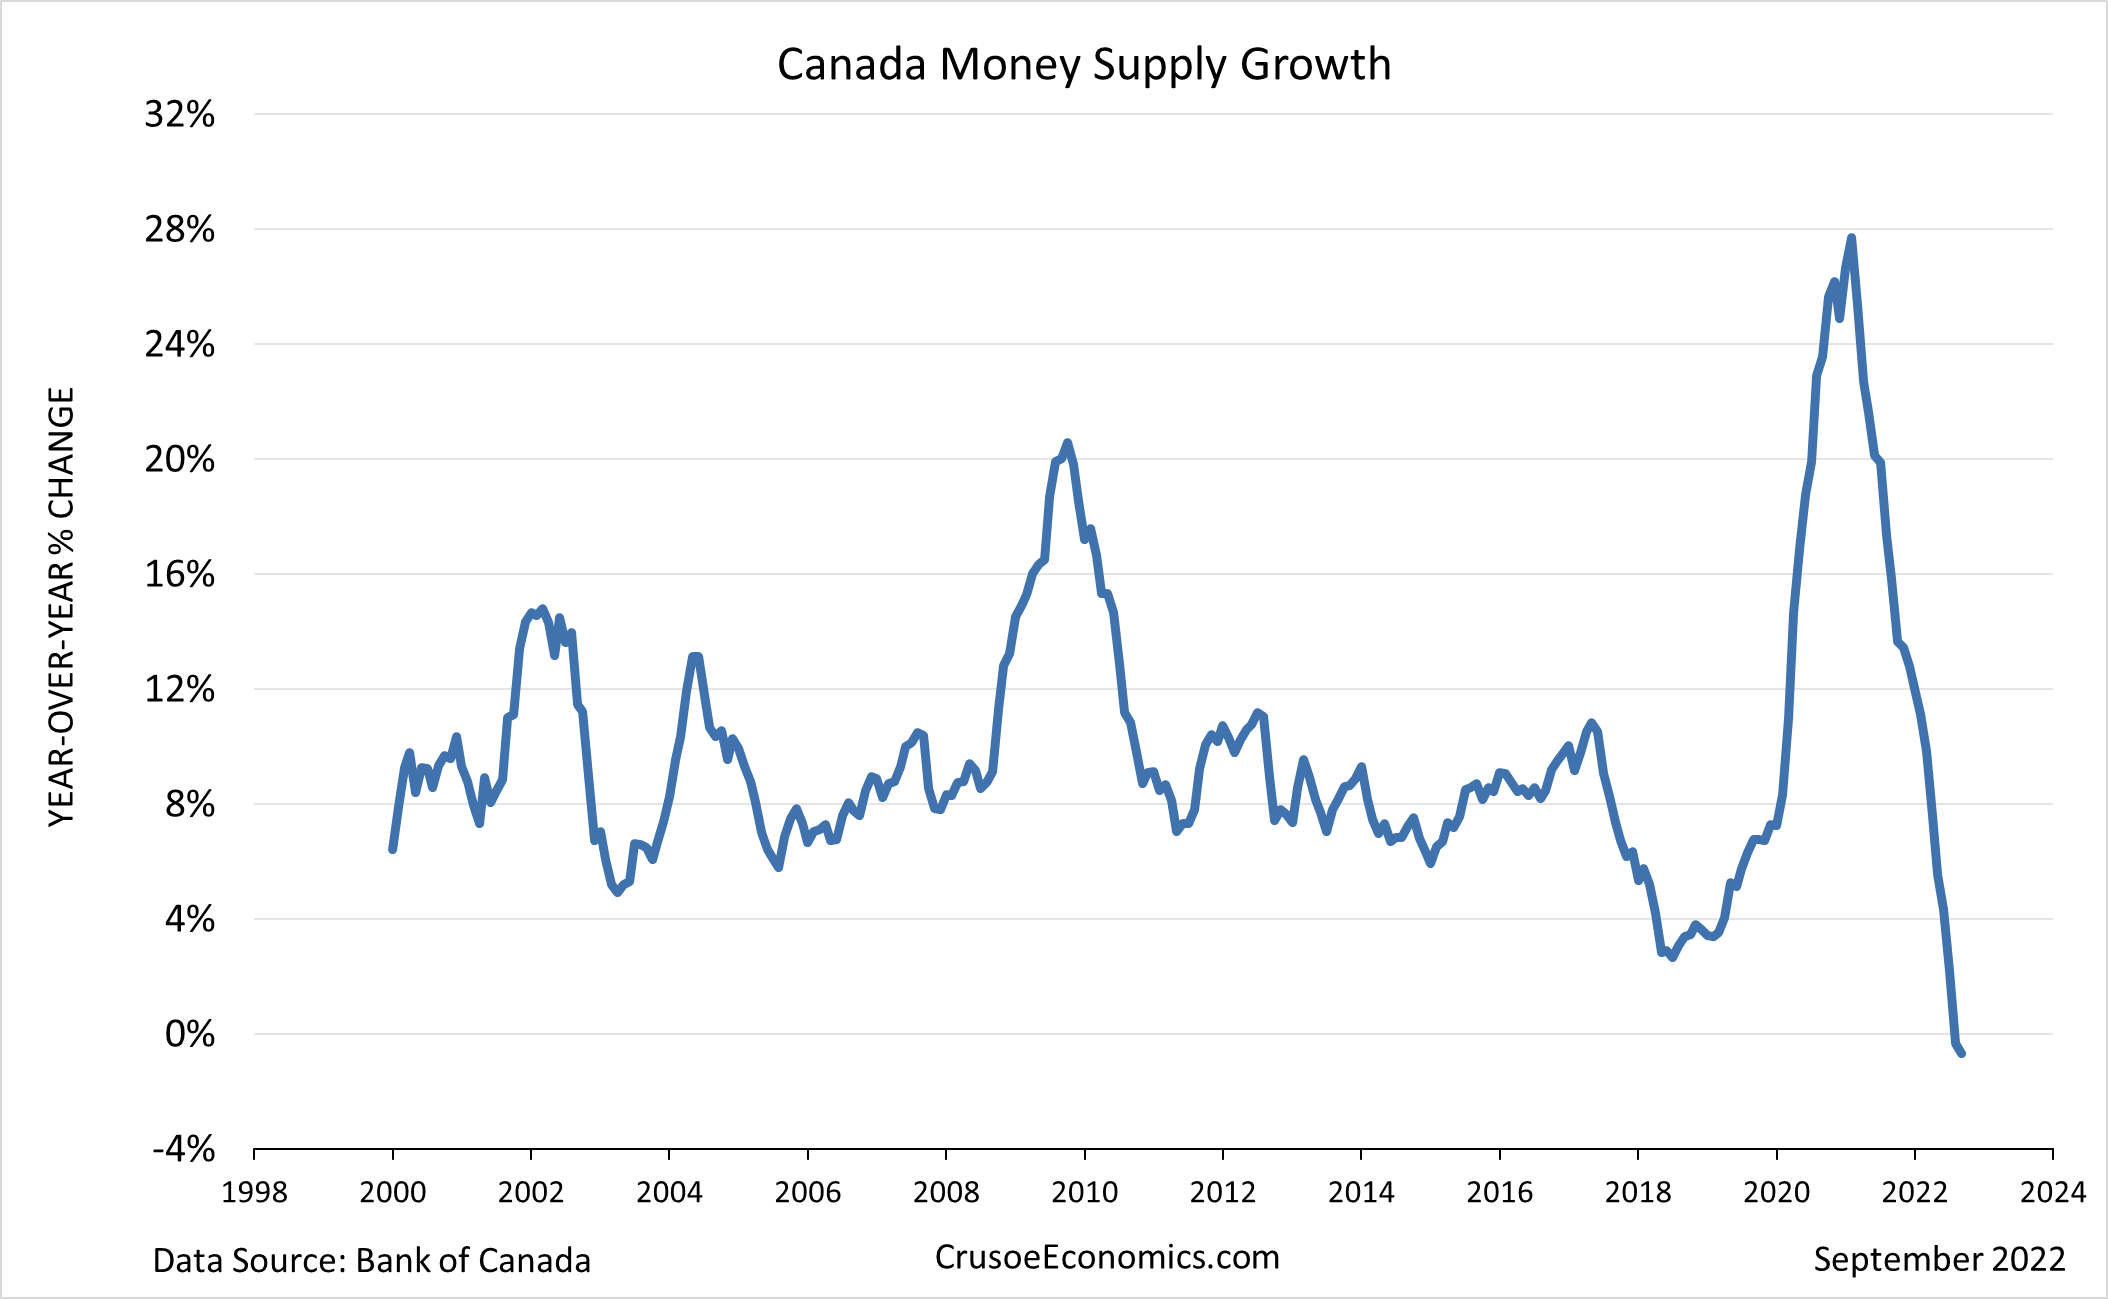
Evidence - including money supply - continues to mount suggesting inflation will continue its descent.