BofA 2023 in 10 Trades
The future could look quite different
Looking Forward
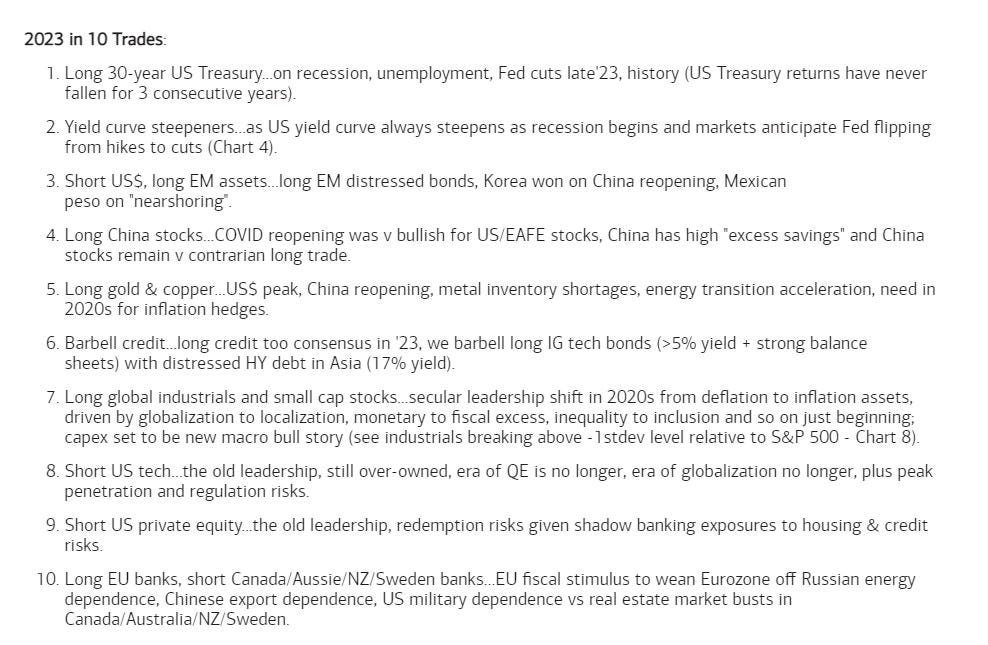
BofA Securities investment strategist Michael Hartnett released his top trade ideas for 2023:
Looking Back
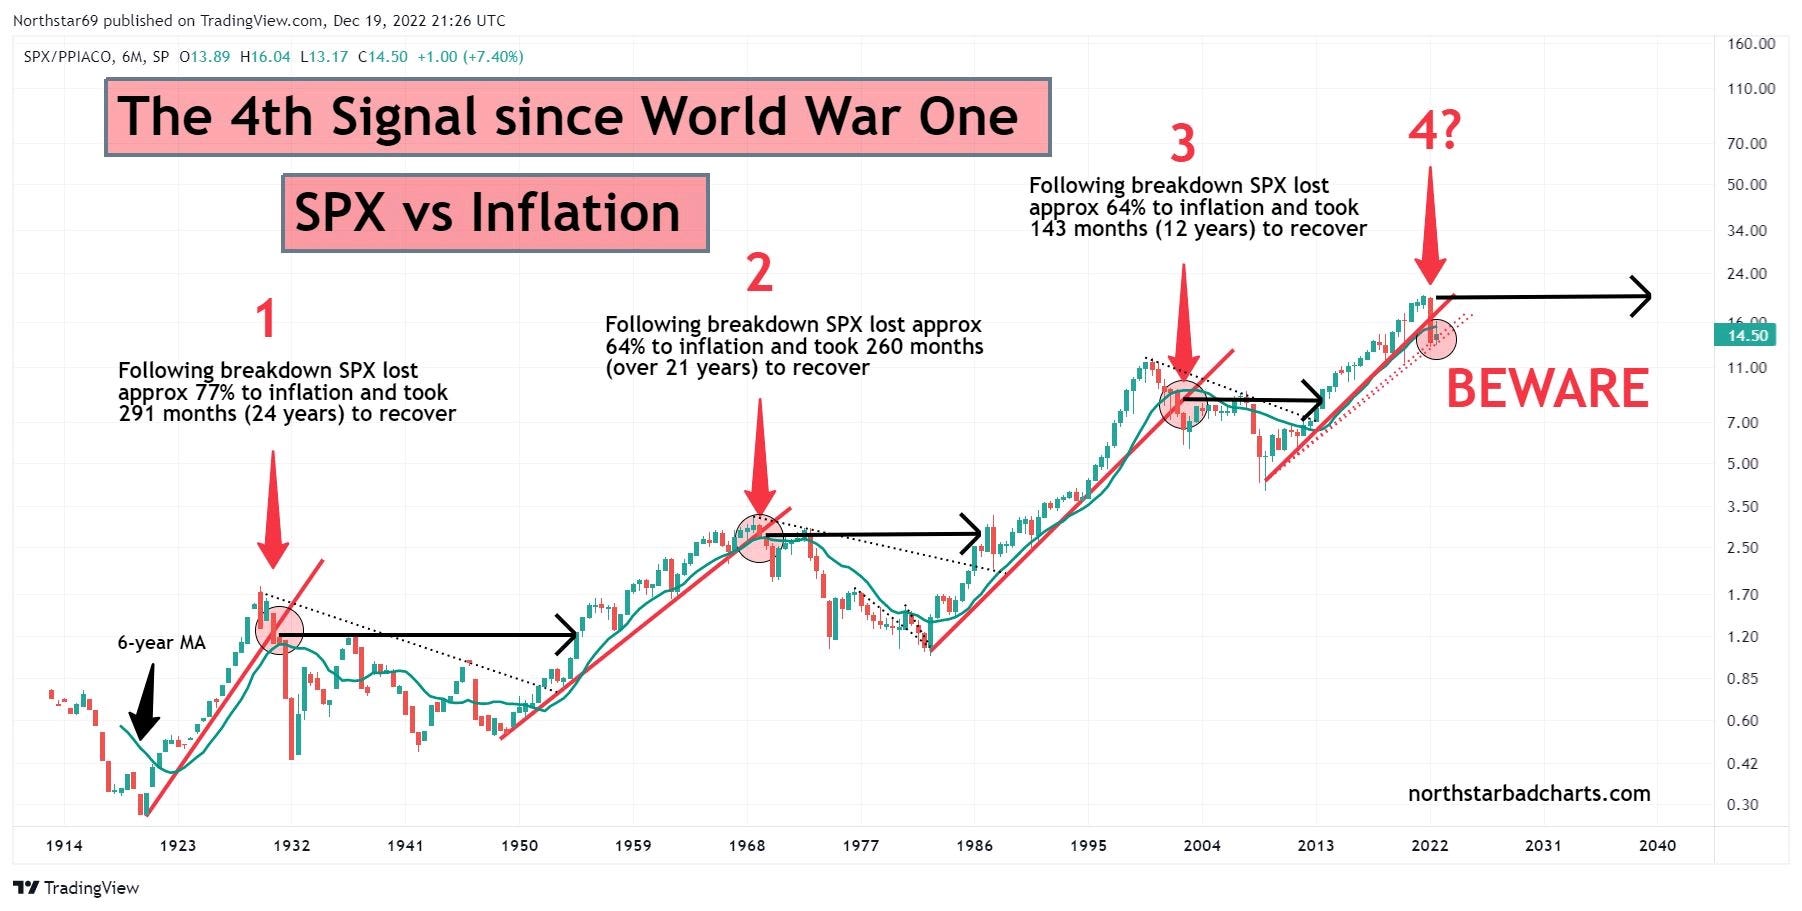
The main point I want to show in the chart below is that the market repeatedly drags itself through long periods of secular stagnation that last up to two decades. Add them all up, and the S&P 500 has spent half the past century moving sideways.
Over the long run, capitalism has proven to be a great wealth creator. However, most investors only have about 30 years to build their retirement fund. Generational experiences have varied widely over the past century.
Some analysts today argue we may be at the start of another long period of market stagnation. Yet, just a couple years ago many were forecasting a ‘roaring ‘20s’.
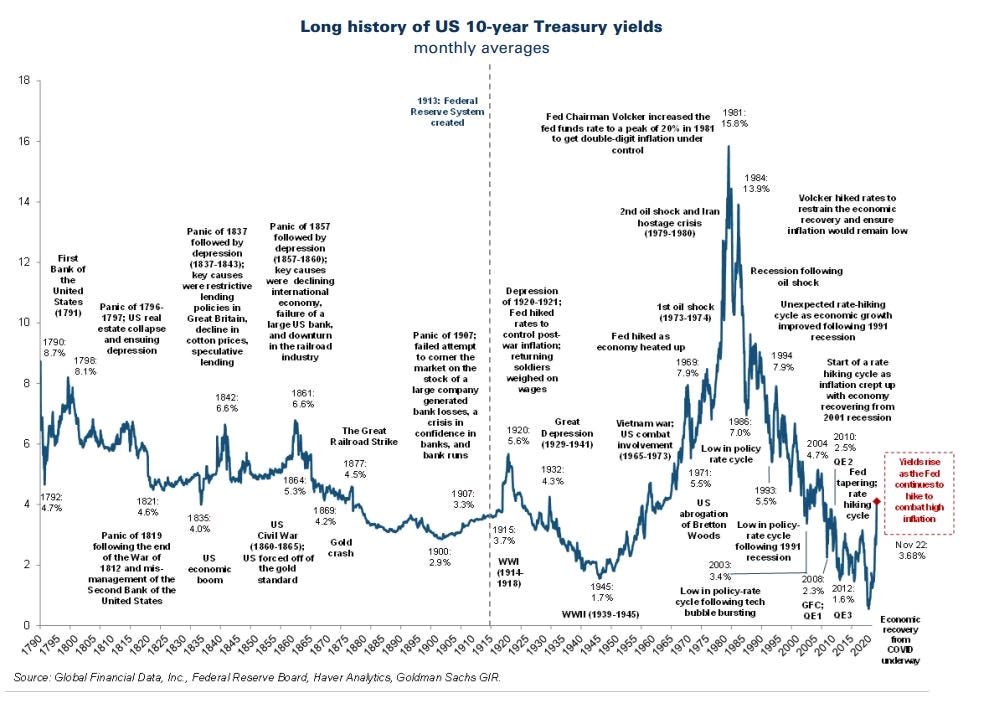
Speaking of generational investing experiences, the run from 1982-2020 is as unique as it gets. The disinflationary rising tide since 1982 - coupled with a secular decline in interest rates - helped raise asset values across the world. (Look at the steep downward sloping line after 1982 in the chart below.)
This experience has never happened before and may never happen again, yet much of modern finance relies on recent history (40 years) when modelling future predictions. Another reason to take forecasts with a grain of salt.
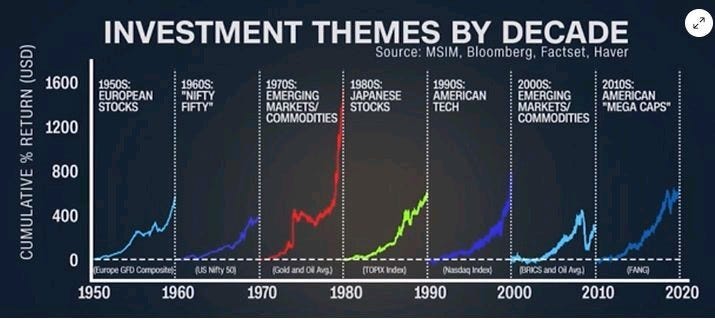
Finally, this last chart shows the best investing themes by decade. While it doesn’t have much predictive value (although one could argue the 1970s has some parallels to today), it shows how winners can change dramatically over time. Big tech led the market over the past decade, but the future could look quite different.