


How inflation affects stocks
Also: Beware of the rise of the zombie company
1: Population growth by Canadian city

Source: Statistics Canada
2: The rise of the zombie company!
The number of companies with interest coverage ratios <1 continues to grow.

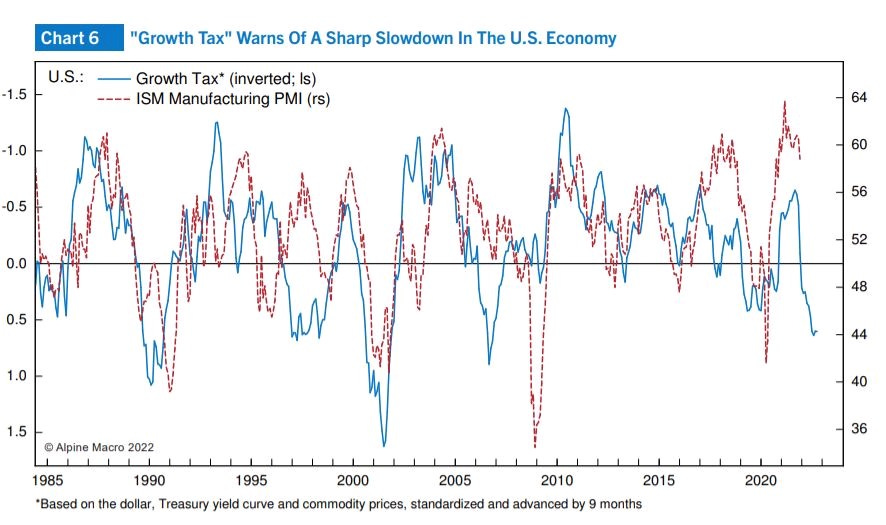
3: US dollar, Treasury yield curve and commodity prices signaling potential for slower growth
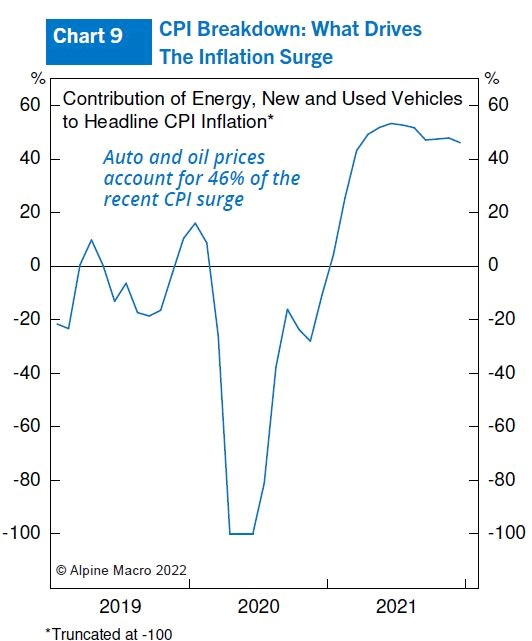
4: A big portion of recent inflation is being driven by car and gas prices
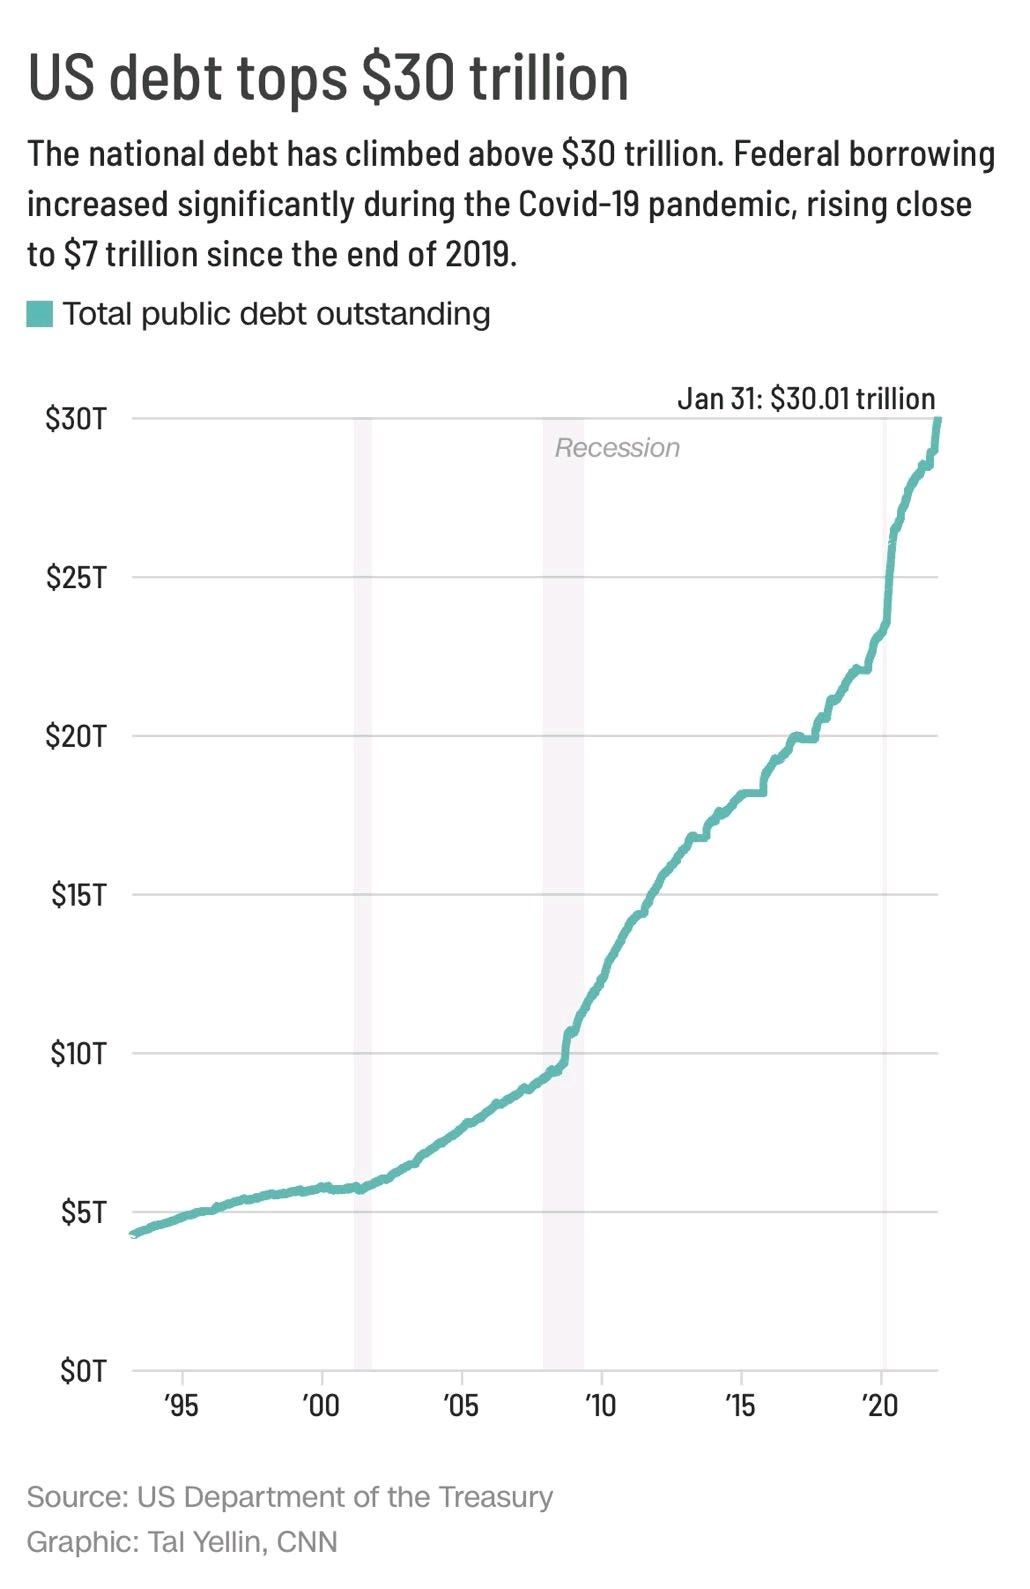
5: As of January 31st the US national debt breached $30 trillion for the first time
Of course, in real terms the value of outstanding debt should be adjusted down to account for inflation. Perhaps this is why central banks around the world have been slow to combat inflation? Financial repression at its pinnacle.
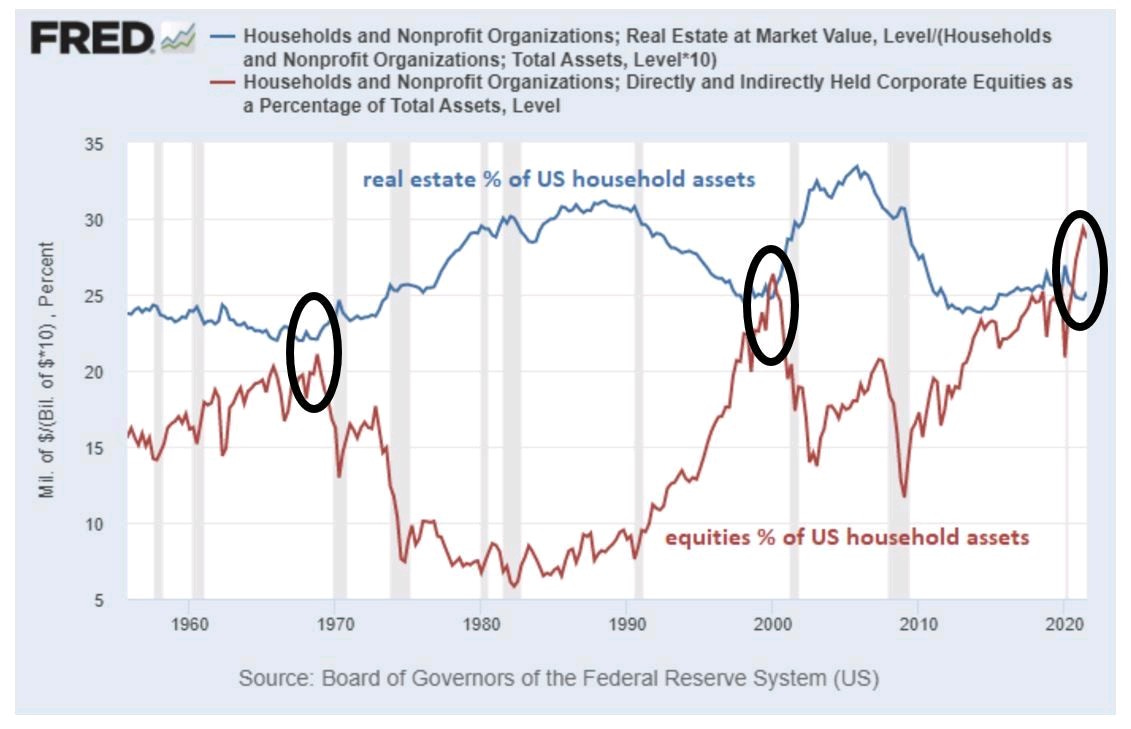
6: Everyone’s an investor. Equities as a proportion of US household assets at peak levels.
Contrarian signal? Possibly. But also related to accessibility and falling transaction costs.
7: How inflation affects stocks
Inflation doesn’t impact all companies (and their share prices) the same. Some are able to pass on costs to customers while others get squeezed.
The top-down and bottom-up flow chart below, created by NYU Finance Professor Aswath Damadoran, provides an analytical framework to isolate inflation's affects on free cashflows, risk and the discount rate.
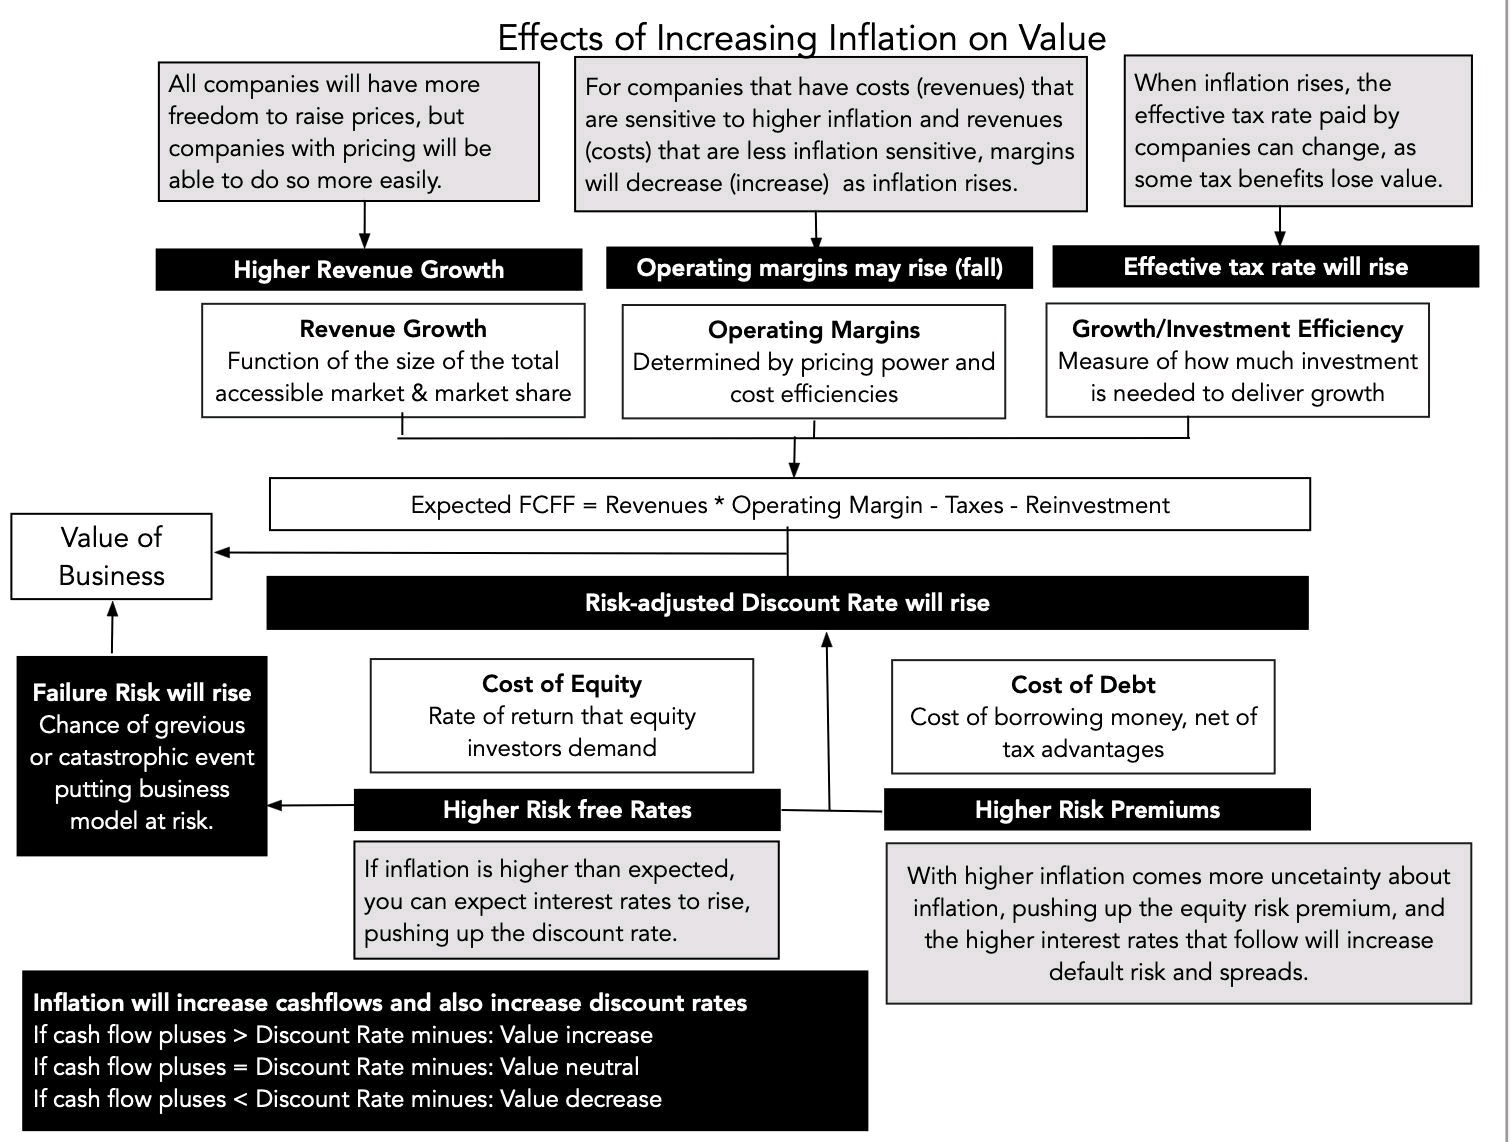
Source: Aswath Damodaran, Professor of Finance at the Stern School of Business at New York University