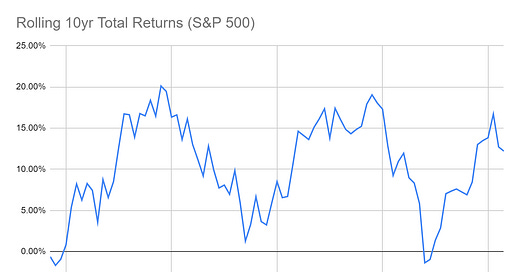
Despite long-run average returns of roughly 10% for the S&P 500, performance isn’t consistent year-to-year. A recent question from a reader got me thinking about “investing dead zones” - long periods during which equities move sideways.
Using rolling 10 year calendar returns, the chart below shows three prominent dead zones over the past 100 years: the 10 years ending 1938 (-1.67%), the 10 years ending 1974 (1.29%) and the 10 years ending 2008 (-1.36%). (All returns shown are annualized.)
For consistency’s sake, I kept the measurement to 10 years. You could measure these dead zones by looking at drawdowns from peaks and time to recovery or simple decades.
Regardless of how you look at it, there are long periods of time during which a buy-and-hold investor could lose money or barely come out positive.
I took this a step further. The previous analysis assumed an investor invested a lump sum at the beginning of the 10 years and walked away. What would happen if the investor split their investment across the 10 years? This is more relevant to most investors who contribute on a regular basis.
As you can see in the chart below, periodic investing outperformed during the 1930s but not in the other two periods. The reason one methodology outperforms the other is likely driven by the timing of calendar year returns during the 10 year period.
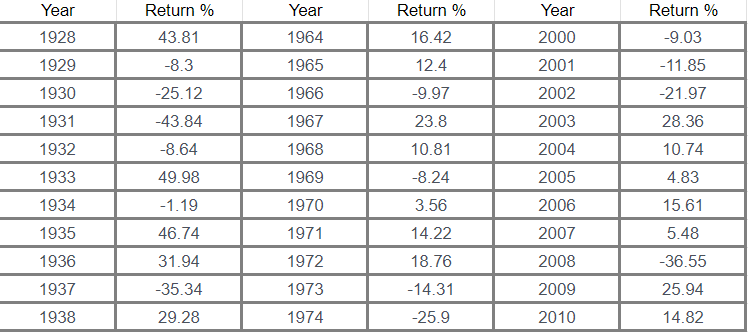
As you can see in the table below, there is an assortment of both positive and negative calendars during each period. In other words, the market doesn’t move consistently downward or sideways.
What if you could somehow avoid the worst year within each of those 10 year periods?
If you were able to shift to cash for the worst year of those three 10 year periods, it would significantly change the outcome. This is especially true for the periods ending 1974 and 2008, because the final years in both periods were the worst of the 10.
Of course, this is easier said than done. But it demonstrates the value of watching for the signs of a big potential market drawdown.


