S&P 500 performance during previous rising rate periods
1: S&P 500 performance during previous rising rate periods
This table shows the cumulative total returns for US stocks during previous major rising rate periods. As you can see, most periods experienced positive returns.

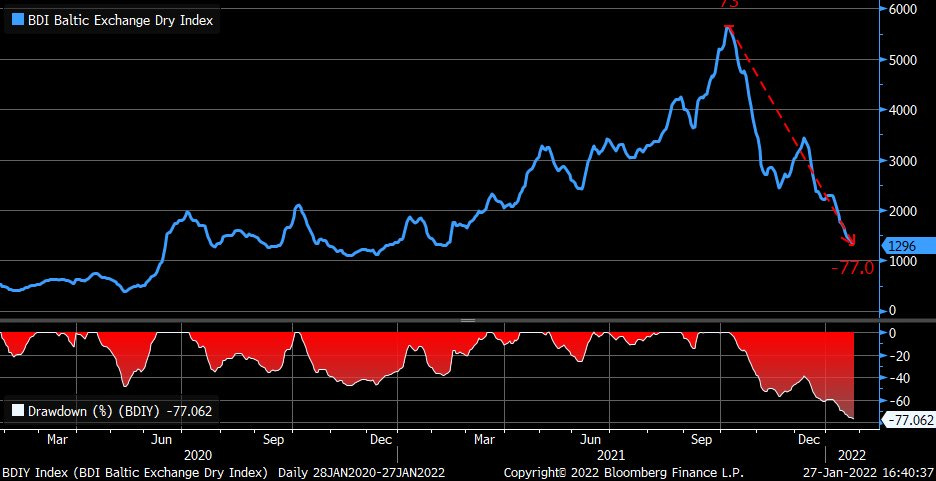
2: Baltic Dry Index is down about 77% from its recent peak
Many mistakenly use this as a proxy for general shipping rates, but in reality this index is driven by demand for specific commodities such as iron ore. Slowing Chinese demand for the iron ore is the main driver in this case.
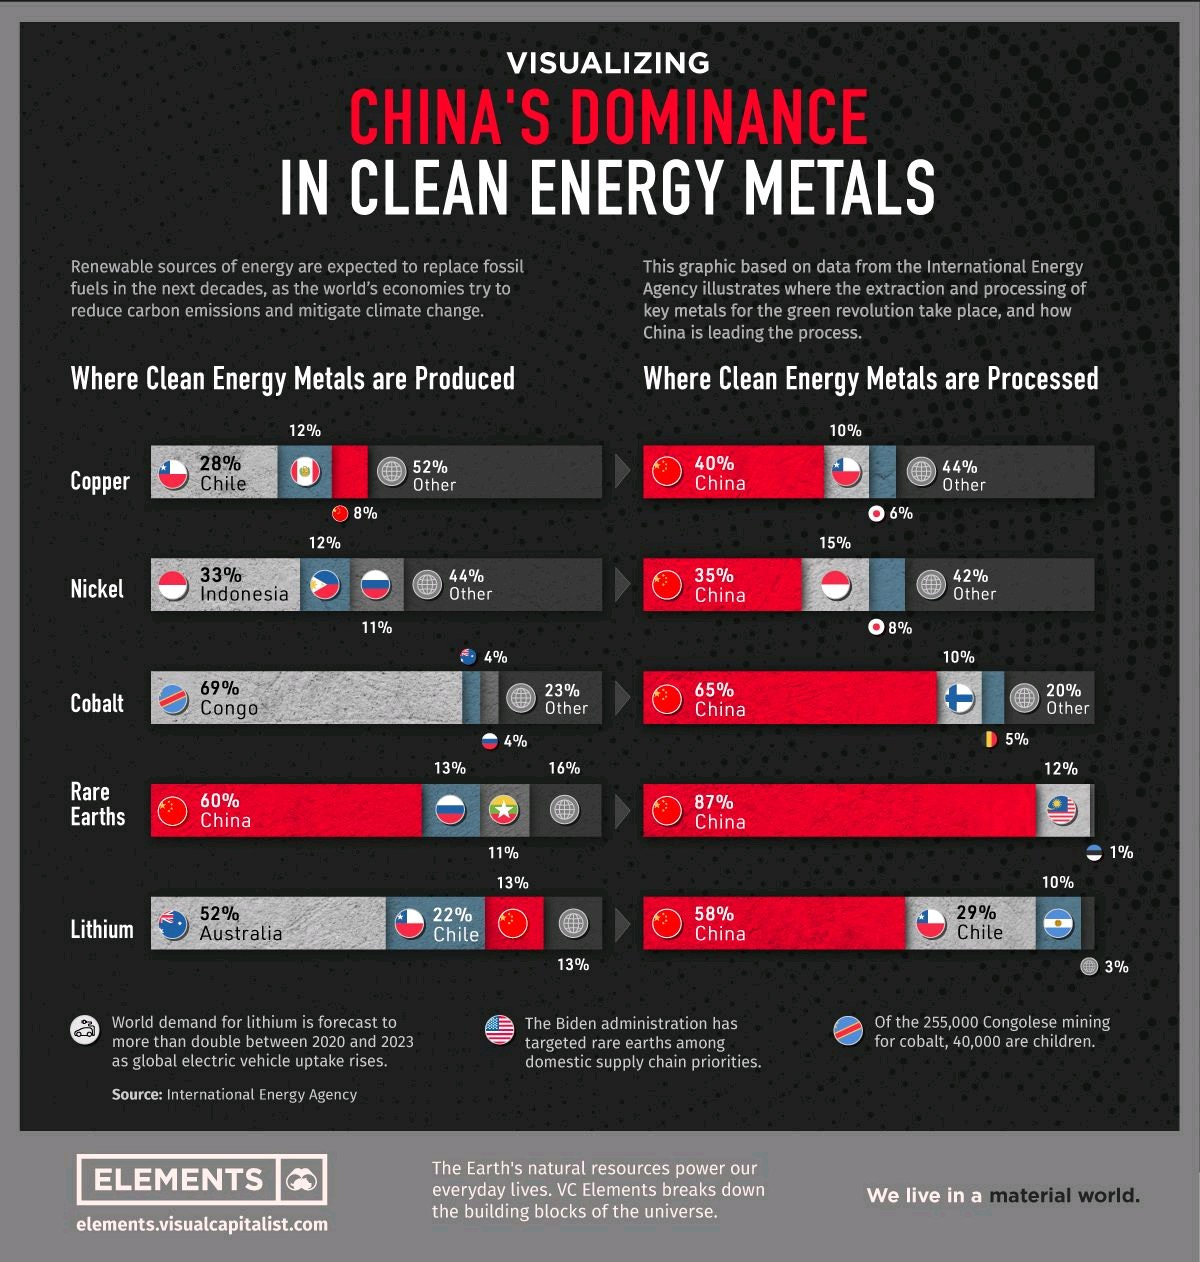
3: The green energy revolution is heavily dependent on Chinese processing capacity
Like it or not, China and America are joined at the hip when it comes to bilateral trade and financing. In some sense, this level of interdependency with an economic rival is a good thing. China and America are less likely to risk it all by starting a hot war.
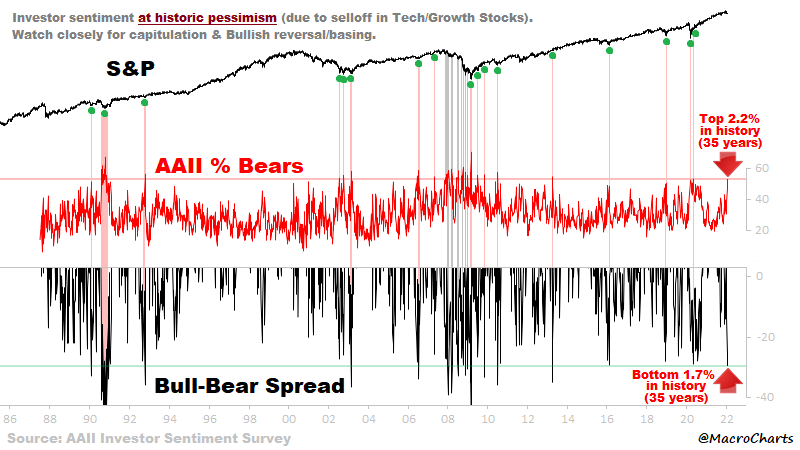
4: Bearish sentiment at peak levels
Extreme sentiment tends to be a contrarian signal. Today, extreme bearishness implies investors are probably pricing in the worst case scenario. When the worst is already priced in, stocks usually have little room to fall further (at least over the near term).
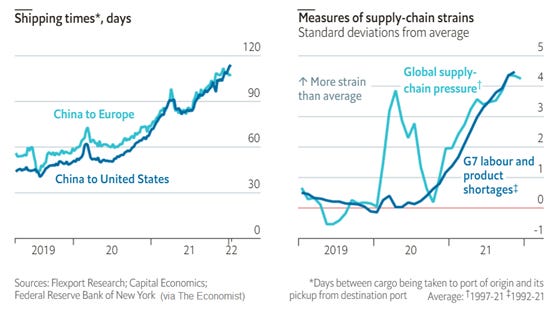
5: Supply chain strains remain elevated
It now takes almost 3 times longer to ship stuff from China.
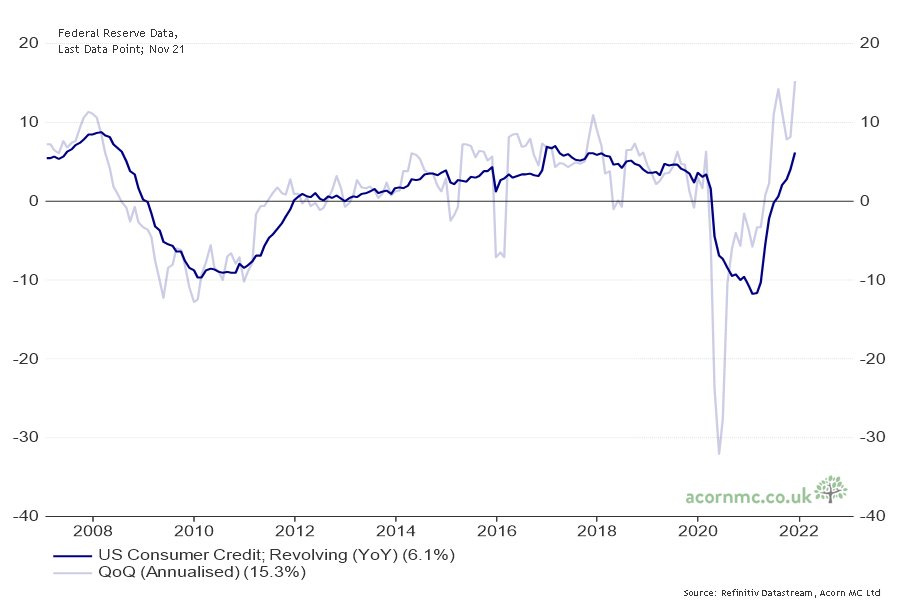
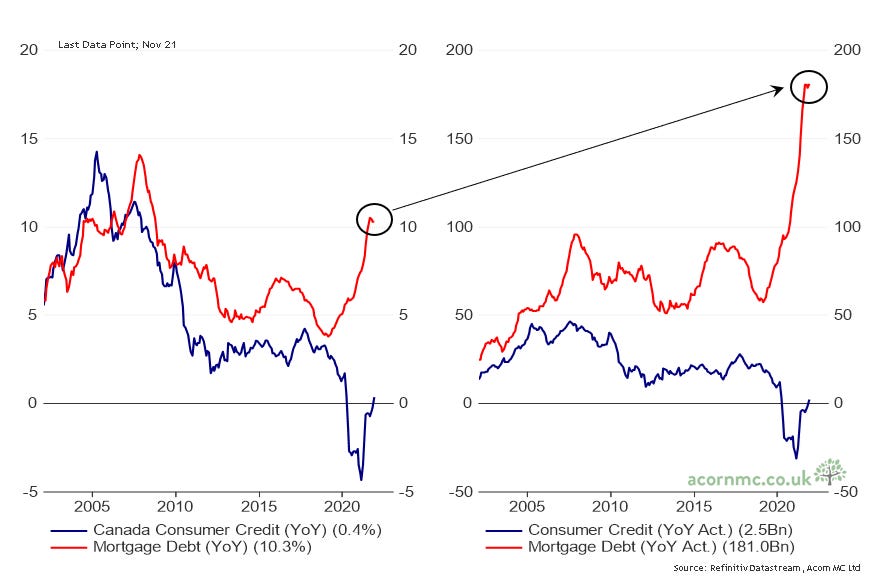
6: Consumer credit growing rapidly
This may suggest robust spending in the US as consumers anticipate higher prices. Unfortunately, credit creation means more money is entering the system, which is inflationary. This is how inflation can become a self fulfilling prophecy.
In Canada, however, consumer credit growth is flat while mortgage debt growth is skyrocketing. Canada is increasingly tying its prosperity to the price of real estate.
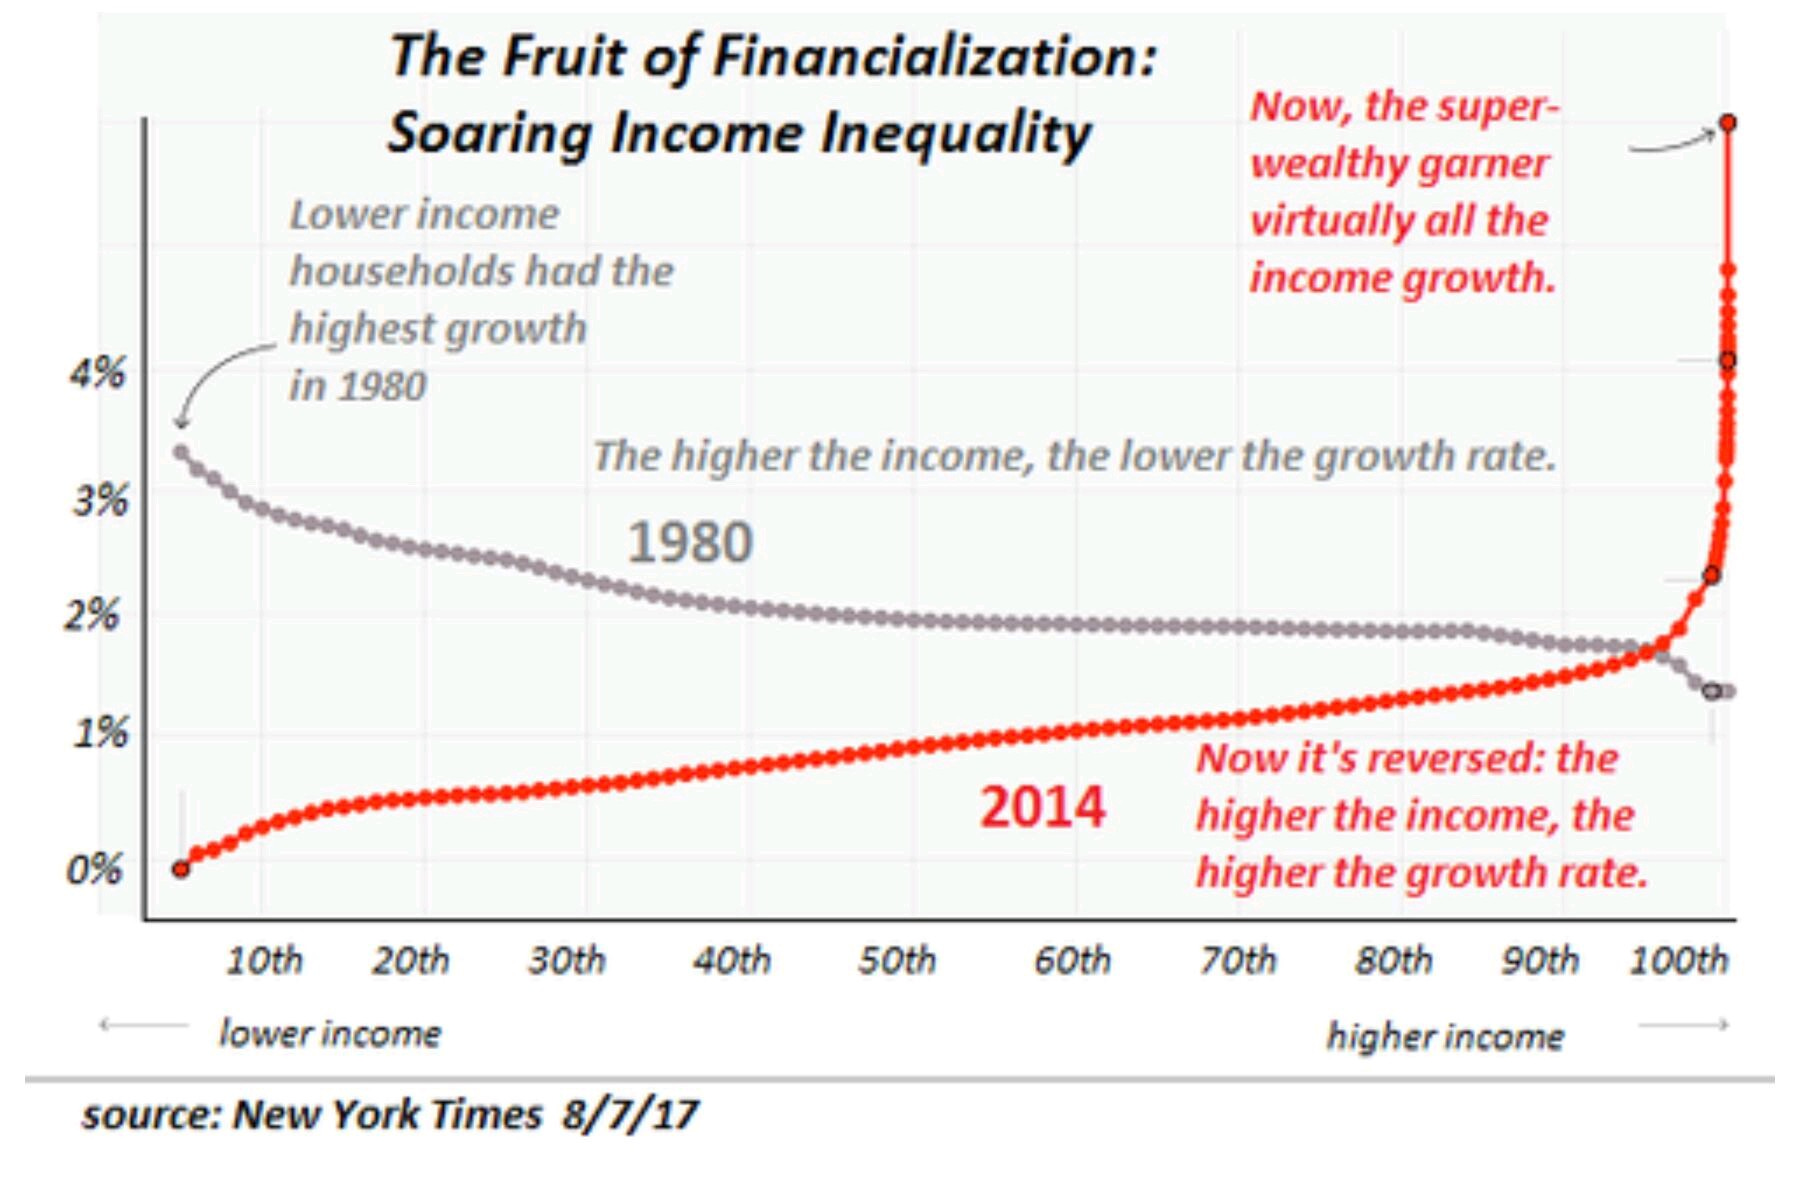
7: Income gains by income level: 1980 vs 2014
In 1980, people with lower income levels saw greater wage gains than the rich.
In 2014, the biggest income gains went to top earners.
This single chart can explain why the population is increasingly turning on itself.