Thursday charts: home price declines + Powell pivot
A few charts for a Thursday night.
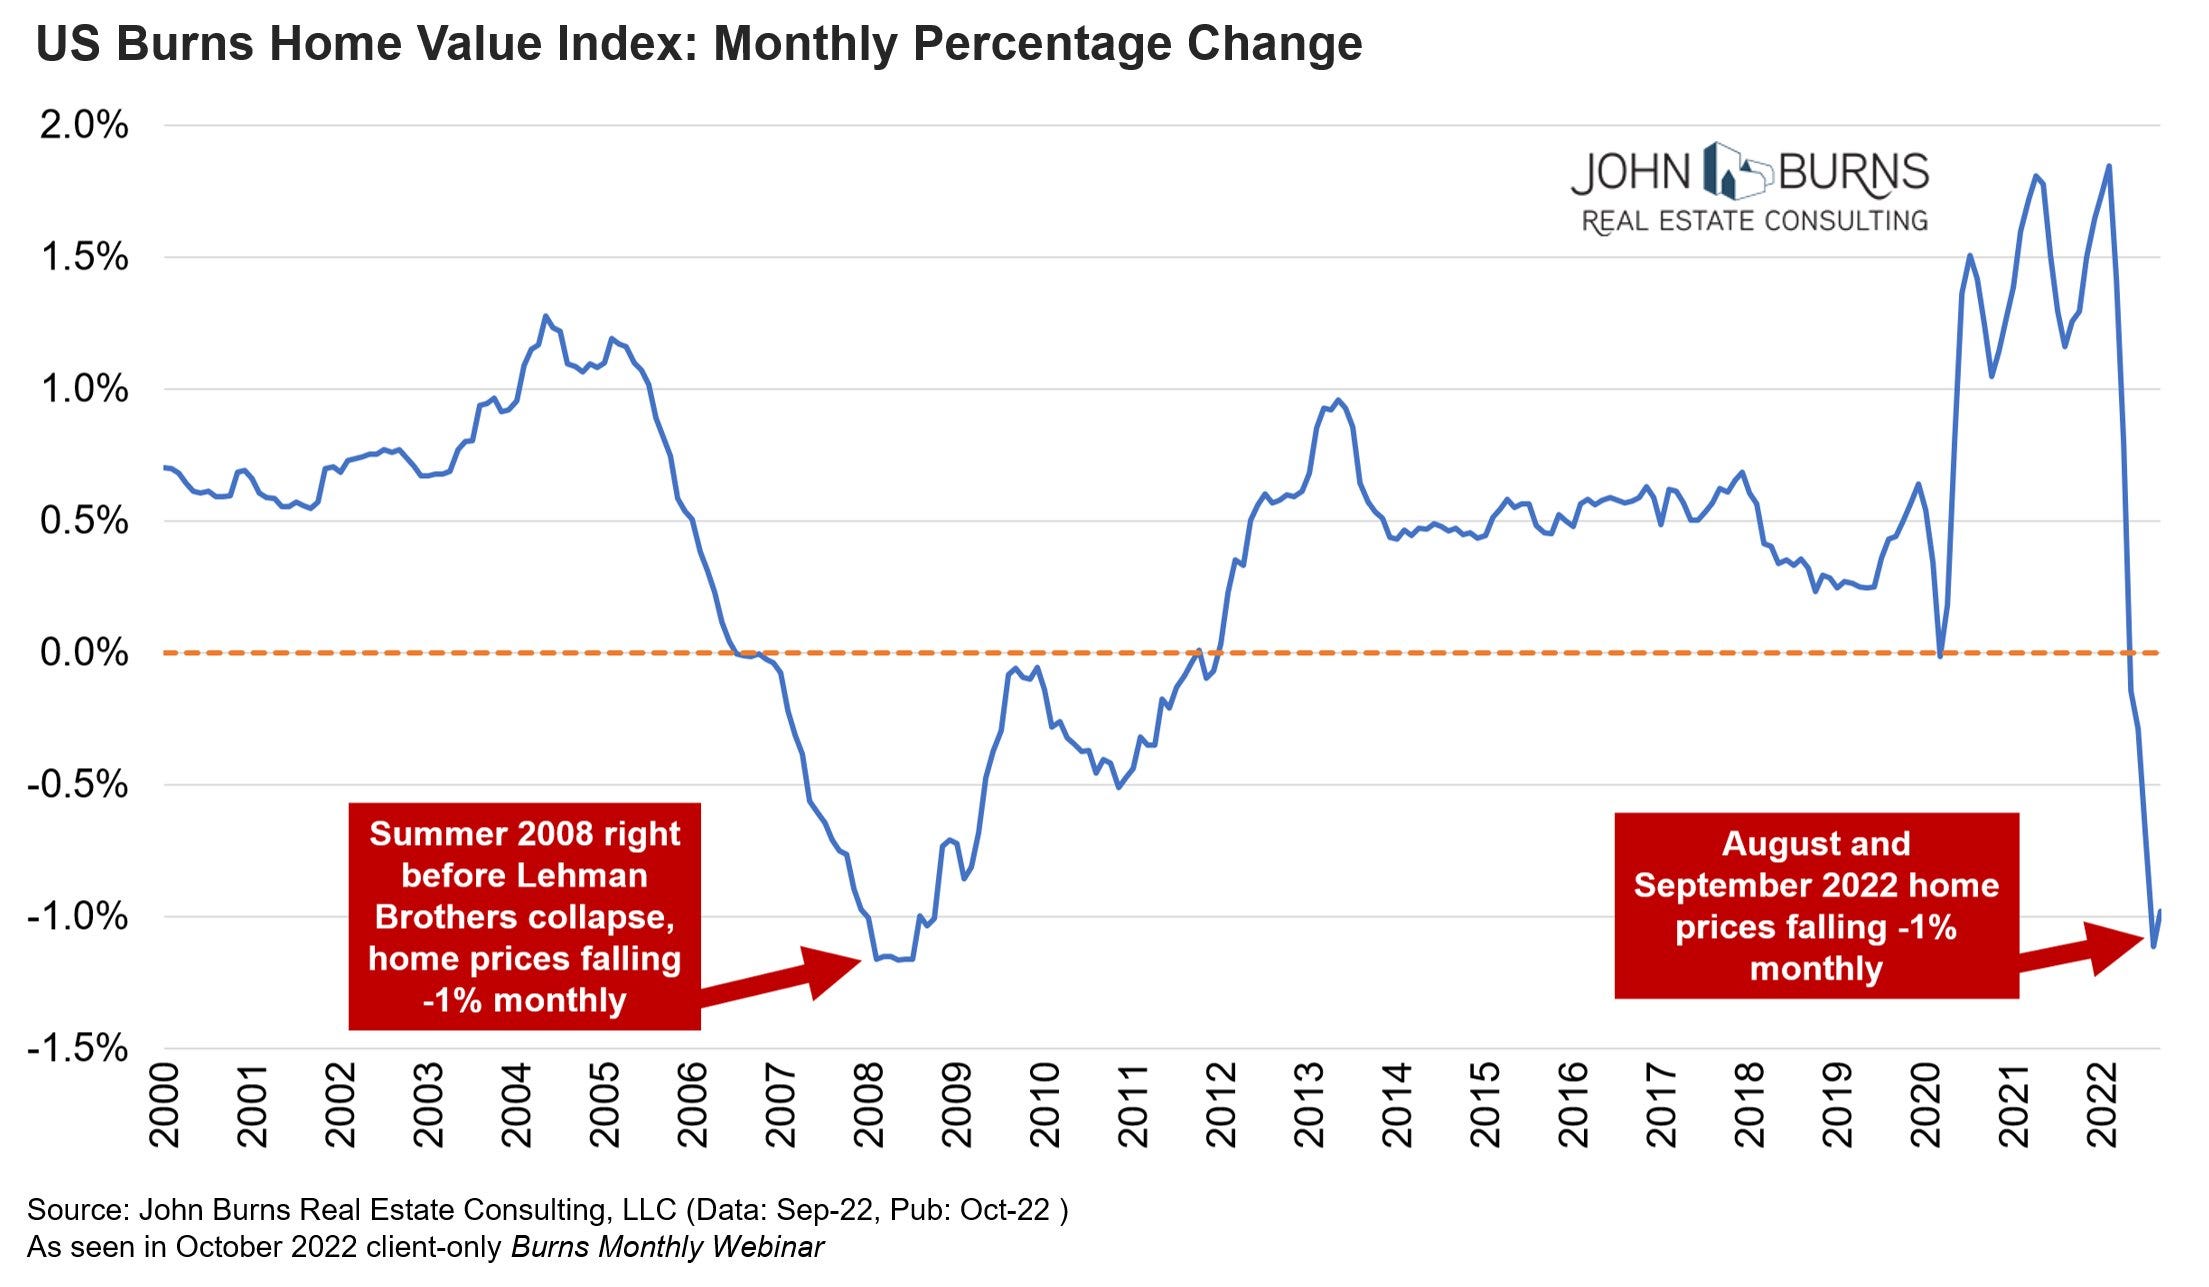
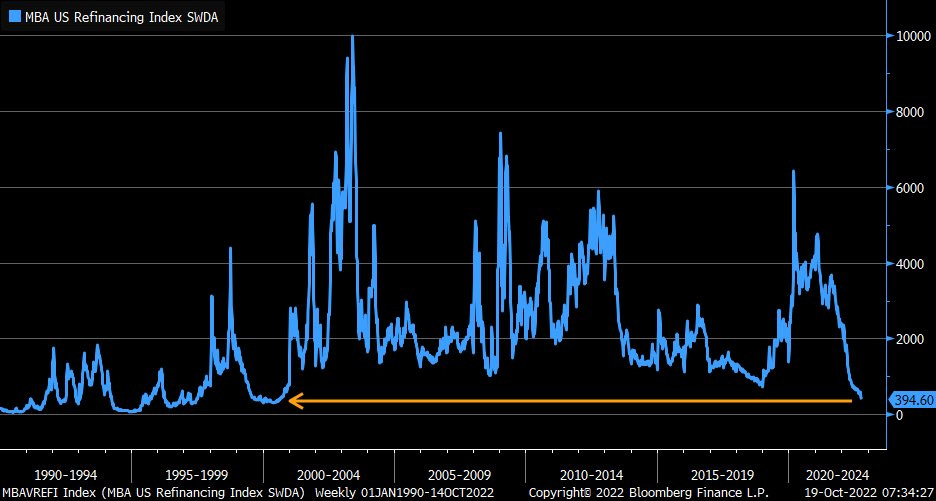
1: US home prices are declining at a pace not seen since the Global Financial Crisis. Also, mortgage refinancing (second chart) is at a level not seen for 20 years.
This doesn’t mean we’re going to see another subprime mortgage crisis. However, it does point to underlying weakness in the US economy, as declining home prices and lower refis result in a negative wealth effect. You can’t expect consumers to be enthusiastic when they can’t use their homes as ATMs.
2: The market strength over the past several days has some thinking a Fed pivot is imminent. I think we are getting closer to a pause.
The case for a pause is growing. Commodity and home prices are deteriorating, core PCE (the Fed’s preferred measure of inflation) is plateauing (chart below) and the 3mth-10yr Treasury curve has inverted and inventories are piling up. Even buried within today’s strong GDP release are signs of soft consumer spending and collapsing construction spending. (And the housing charts above suggest more stress ahead.)

While the economic data is weakening, inflation remains well above target. Moreover, the labor market is still strong so the Fed still has runway to maintain tight policy. But that runway is getting shorter by the day.
To get core PCE from 5.8% to 2% the economy needs to take some serious hits. That means weaker employment, consumption and corporate earnings. Are stocks pricing this in? Or does the market have an unrealistic expectation of what a “pivot” or “pause” would mean? I think the Fed hikes a couple more times and then maintains while watching the data. The only way the Fed actually pivots is if inflation begins to fall, along with the corporate earnings and the economy. Of course, that scenario wouldn’t be great for risk assets.
Recent disappointing announcements from tech heavyweights like Meta and Amazon have pummeled their stocks, showing markets might still be too optimistic. Market-wide, Q3 earnings season hasn’t been horrible so far - likely because companies are passing costs to consumers while suppressing ages. However, as the pressure builds on the consumer, It wouldn’t surprise me if earnings over the next couple quarters deteriorate.
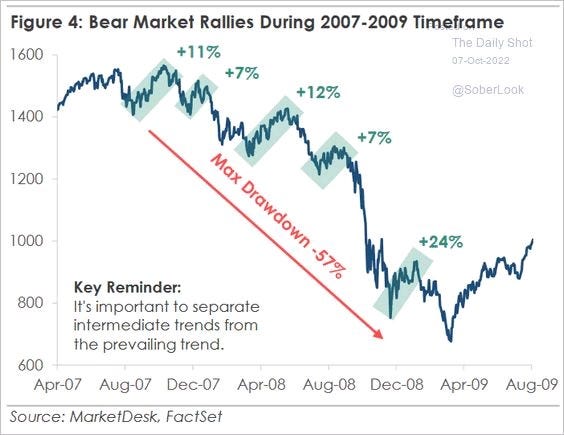
So is the Oct 12 - Oct 27th 6.4% rally sustainable or is it another trap?
Beware: The 57% 2008 bear market decline included five rallies of 7% or more.
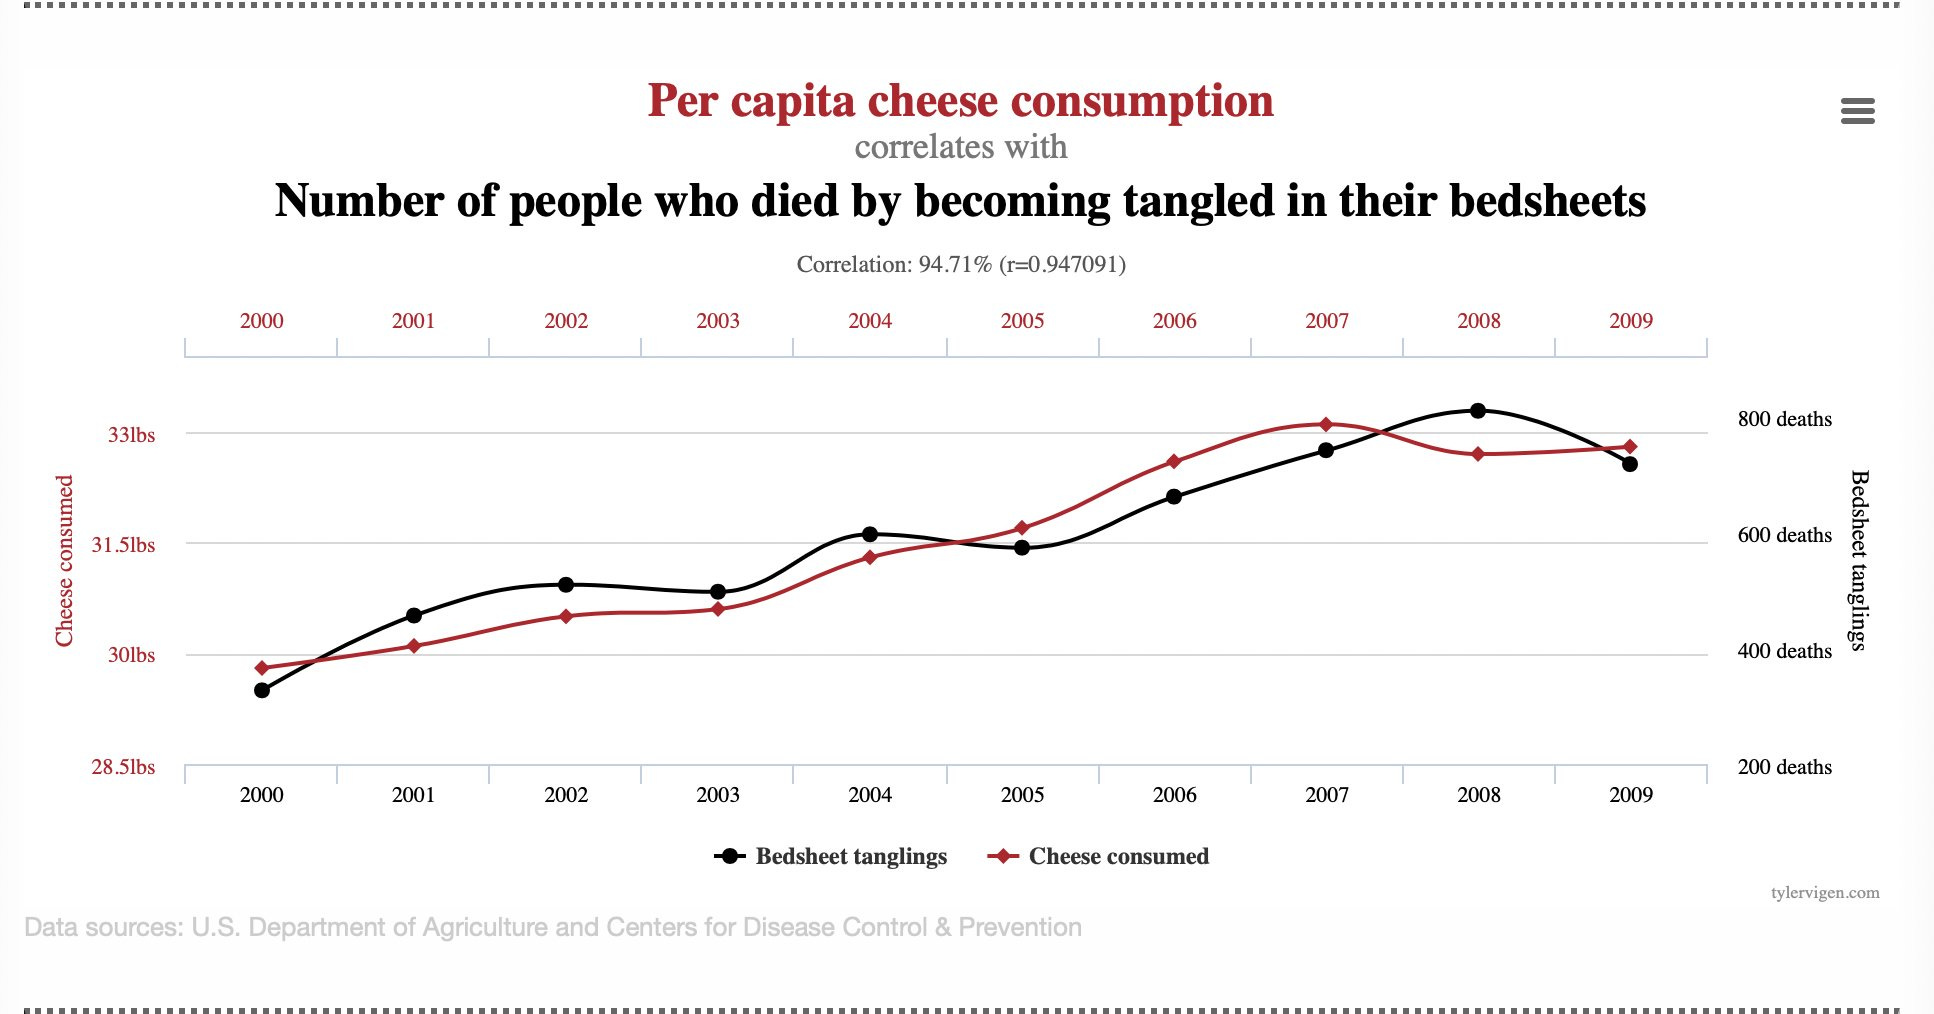
Bonus: Correlation doesn’t equal causation. You’ve likely heard this before. We’re bombarded with research based on correlation statistics in the news. Research identifies a correlation between two data series and the news pounces on it.
Reality is we live in a world filled with erroneous correlations, such as cheese consumption and death by bedsheet: