Try Being a Bull
It comes down to inflation and earnings
“We’re seeing that volume decline in every segment around the world.” — FedEx CEO Raj Subramaniam
I’m a glass half empty kind of person. I’ve seen so many blow-ups that I’m always on the lookout for the next one.
I recognize my mindset, so I fight hard to find reasons for optimism. This mental tug of war has worked well for me most of the time.
For example, seeing what was going on in China, I sold everything February 2020 right before the crash. Then, I started buying again in April of 2020 and later that year I turned wildly bullish. I’ve had similar success in 2022, positioning myself ahead of the bear market, and entering/exiting energy at the right times.
The bull and bear in my brain are constantly fighting. I usually only take significant action when one is clearly winning the fight. Most of the time I do nothing. Today, I can’t say I’m wildly bullish or bearish. I continue to follow the data.
Also important to note, I’m conservative by nature and my primary goal is to not lose capital.
I’m telling you this because below are some of my notes on what I think could re-ignite the bull market at some point.
Question: What’s the hard trade right now?
Answer: without a doubt, convincing someone they should go long risk (stocks, HY bonds, etc.) is a difficult conversation to have.
For this reason alone I think it’s worth exploring the bull case, which comes down to two things:
Positive directional (aka second derivative) news on inflation
Better than anticipated earnings growth
So far #1 (improving inflation data) has remained terrible on an absolute basis. Particularly with Tuesday’s CPI print. (Some economists believe there were positives to be found within the data - the market clearly didn’t think so, with the NASDAQ down almost 6% this week). Still, the direction of inflation may be primed to shift as the amplitude of month-to-month price changes has weakened - and could continue to weaken.
Commodity prices have come down a lot and inventories continue to accumulate, flowing through to prices. This trend might continue if the Russia-Ukraine conflict is resolved and supply chains continue to mend.
Other factors could continue to ease inflationary pressures in the near future. For example, any easing of the labor market will help. Note, however, unemployment doesn’t necessarily have to rise for this to happen. For example, we could just see lower job openings in some sectors, which would mitigate the risk of a wage-price spiral.
Moreover, months of tightening financial conditions should soon start to affect the real economy, which tends to lag the financial economy. Financial conditions (aka Chicago Fed National Financial Conditions Index) started tightening about a year ago, so most of the lag is behind us.
#2 (earnings) has deteriorated, but remains relatively intact despite extreme bearishness. Q2 EPS grew 6%. Ex-energy, Q2 EPS was down about 4%. Down, but not out. Is this the beginning of a trend or just a blip as the US consumer sorts out higher debt servicing costs (mind you, household debt service payments as a proportion of disposable income remains in the best shape in years).
Importantly, 76% of reporting issuers beat earnings expectations in Q2, in-line with the 5 year average.
The market is paying close attention to Q3 earnings, and comments, like the one made by FedEx CEO Raj Subramaniam won’t spark optimism.
Regardless of all the bad news out there, if we get a half-decent Q3 (i.e. high number of beats, low number of lowered guidance) plus some directional improvements in inflation the Bulls just might have a case.
Do I believe this? I’d say it’s one of many possibilities at the moment.
Stay tuned.
Now…back to the charts:
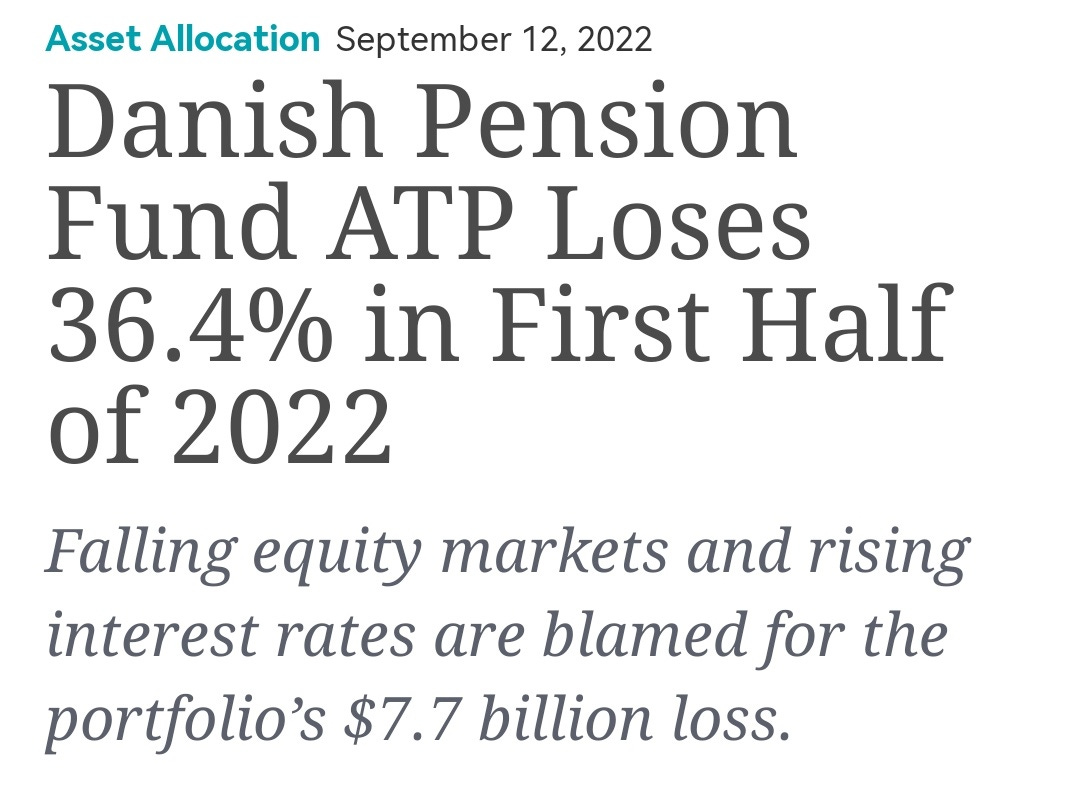
1: Danish pension fund lost 36.4% during H2 2022! My god this is a huge decline for what should be a relatively conservative portfolio.
Seems like converging correlations are wrecking once bulletproof asset allocations.
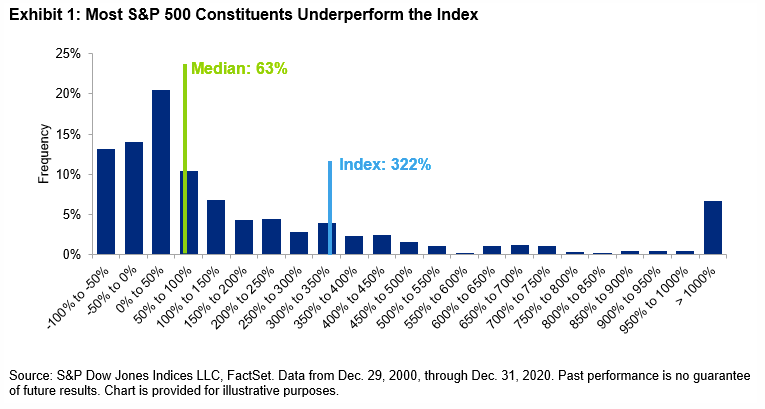
2: The chart below demonstrates the case against stock picking. It shows a distribution of S&P 500 constituent returns during the 20 years ending December 31, 2020. The blue line shows what the broad S&P 500 index did (322% cumulative) during that period. Most companies in the index generated far lower returns.
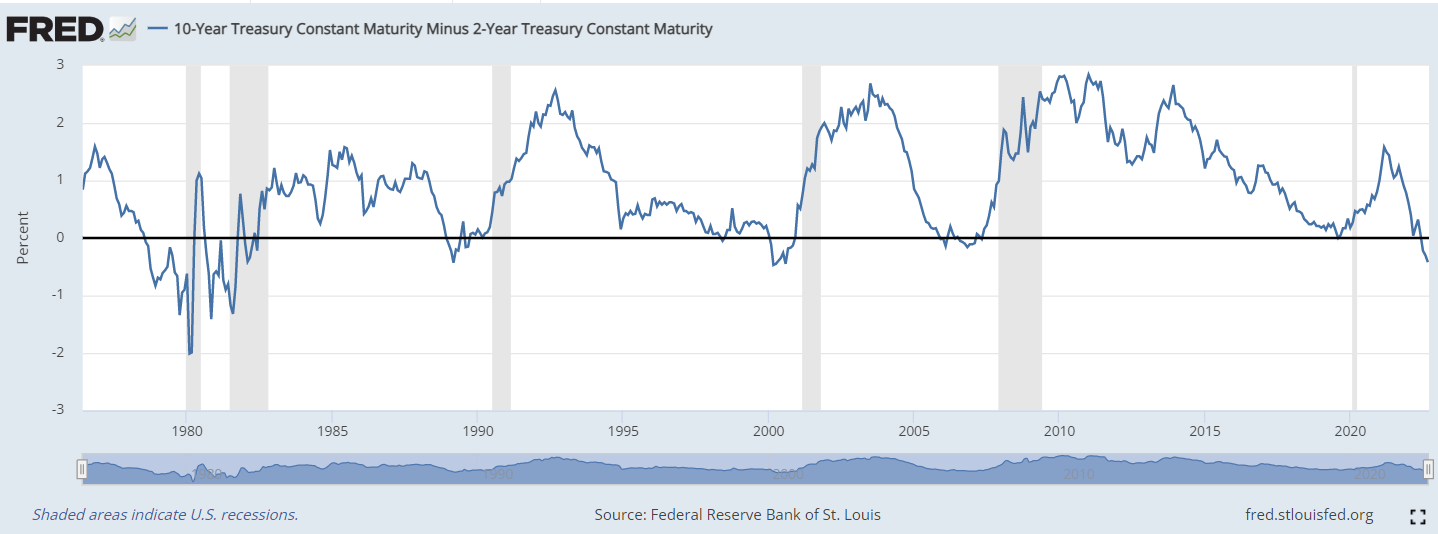
3: An inverted yield curve is typically a signal that a recession is coming. Today, the yield curve (2s-10s) is the most inverted in over 20 years.
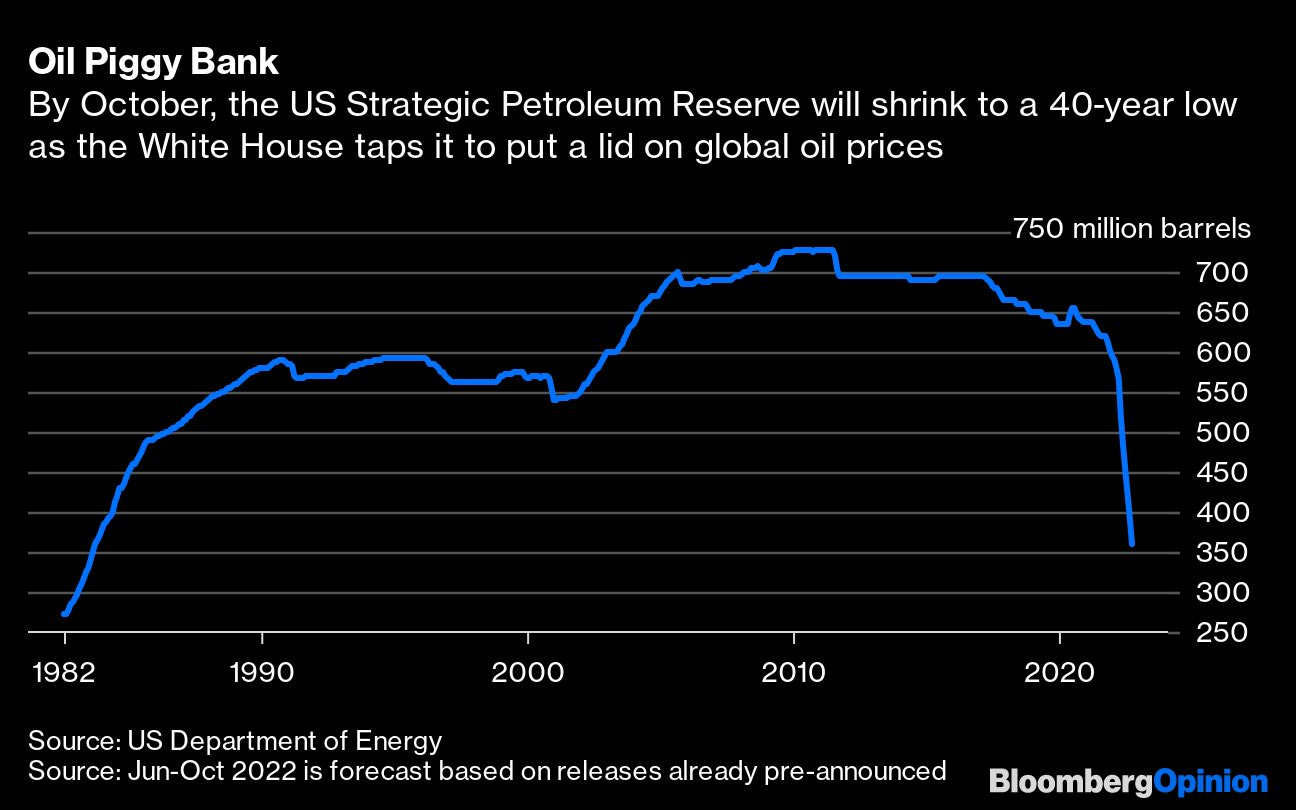
4: The ongoing 1 million barrel daily release from the US Strategic Petroleum Reserve has effectively calmed energy prices, mitigating pain at the pump. Today, however, reserves are at a 40 year low and this tailwind will soon become a headwind when the reserve needs to be refilled. The White House has said it will start refilling if oil hits $80.


