


Some quick hits from around the www.
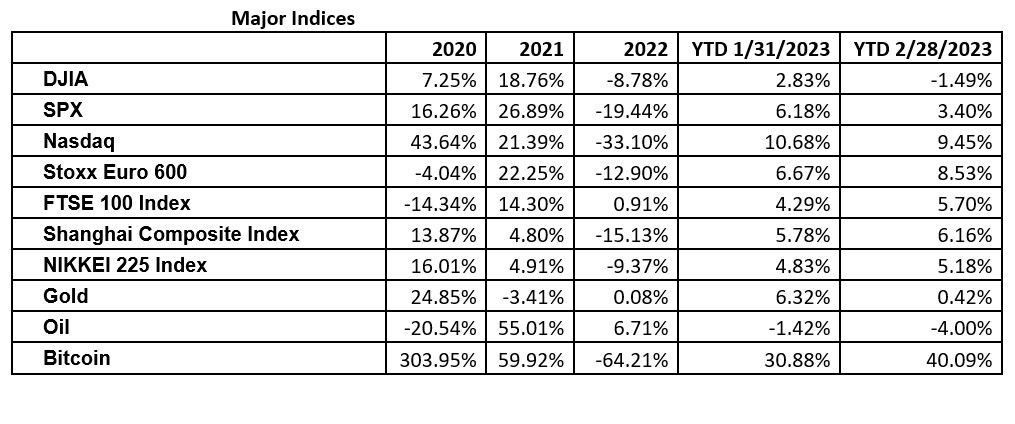
1: February performance for the major indices:
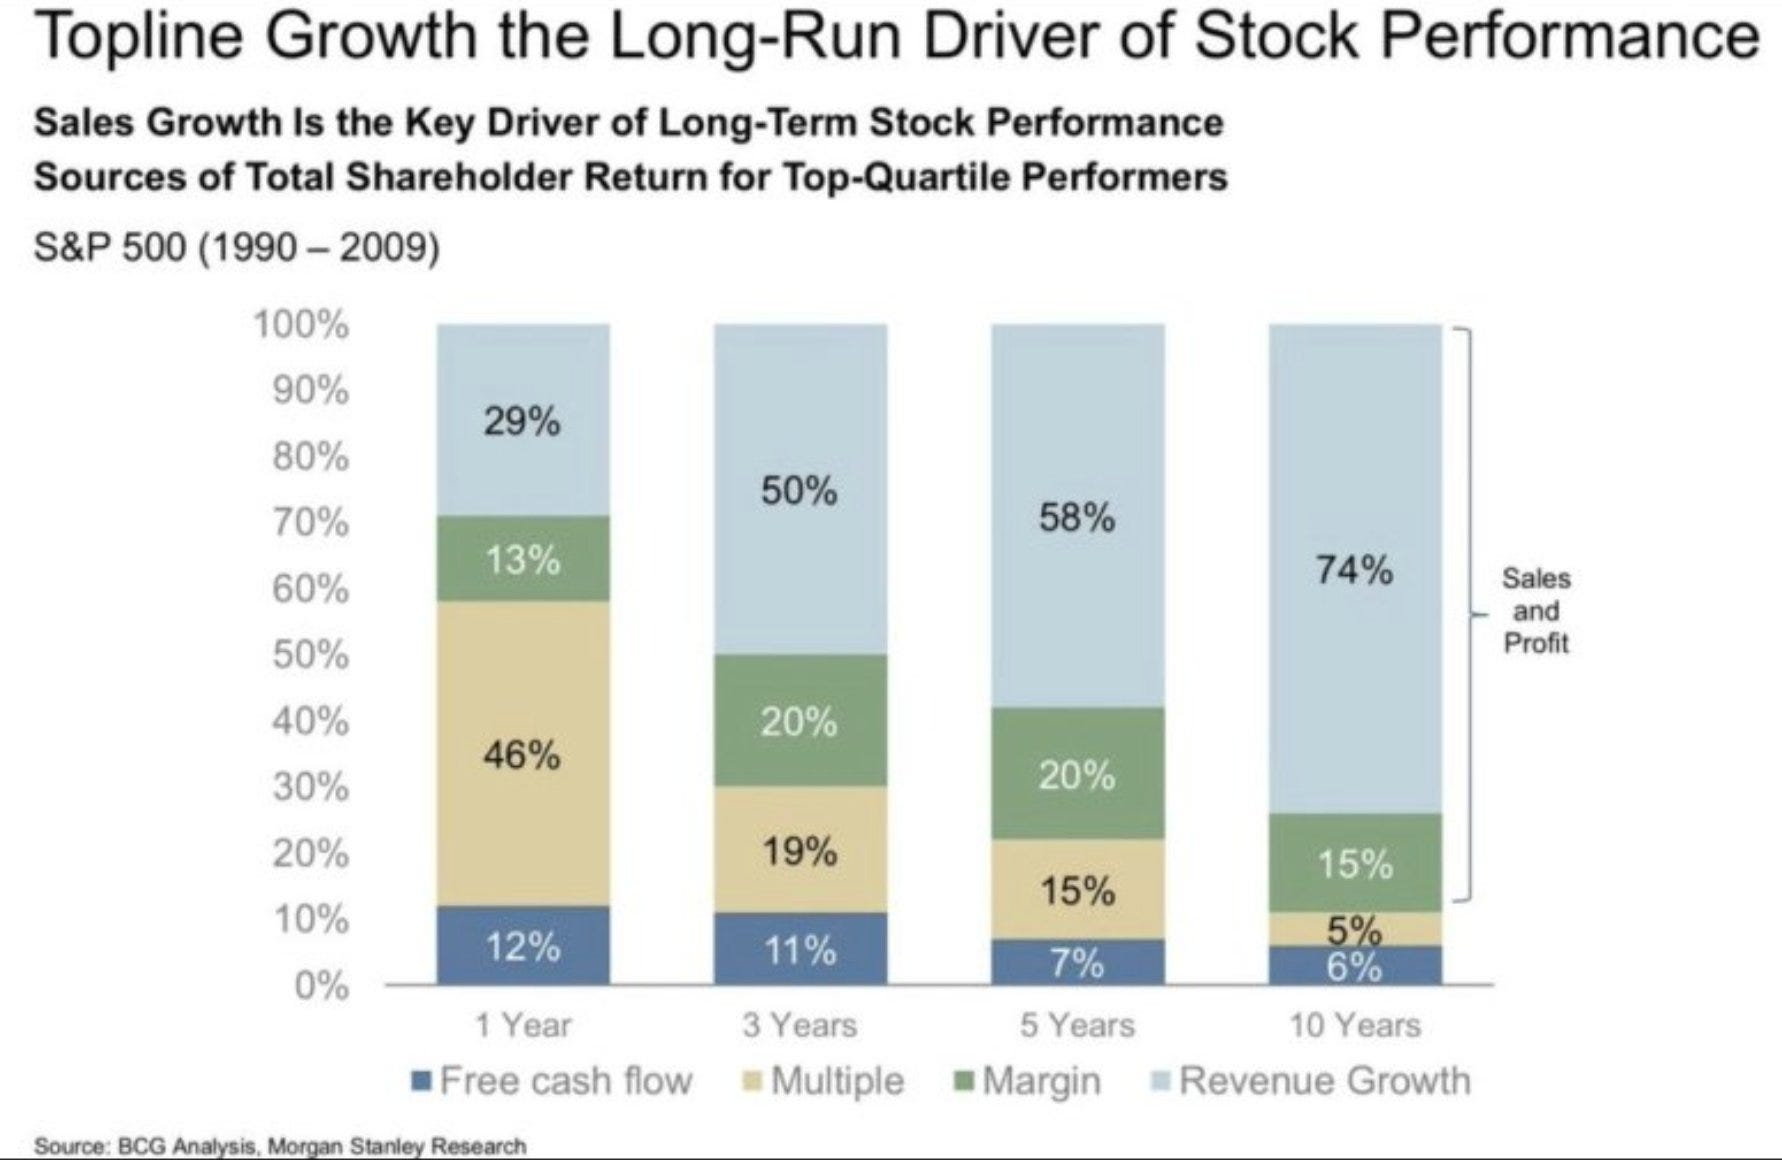
2: Every penny of a company’s cashflow and earnings started as a dollar of revenue. I’ve always used revenue growth as a transparent measure of a business’s progress. While it’s easy to f#!$ with EPS (earnings per share), revenue is less vulnerable to corporate shenanigans. Not immune, just less vulnerable.
Consider this: with the right amount of financial engineering, a company could report rising EPS (perhaps by borrowing to buy back shares) while revenues decline. This might excite investors in the short term, but it’s not sustainable long-term.
So it’s interesting to see the following chart validate this thinking: over the long run, revenue growth is the driver of stock performance.
3: "What do you call a stock that’s down 70%? A stock that was down 90% and then rose 200%." (Source)
Using recent examples, the table below illustrates how after large declines, it requires many multiples of the drawdown in positive returns to get back to even.
