
1: Twin Deficits: A sign of decay

2: Supply chain challenges having a positive affect on Transportation & Warehousing wages

3: Higher wages in the transport sector bringing truck drivers back, although not enough to meet the estimated need

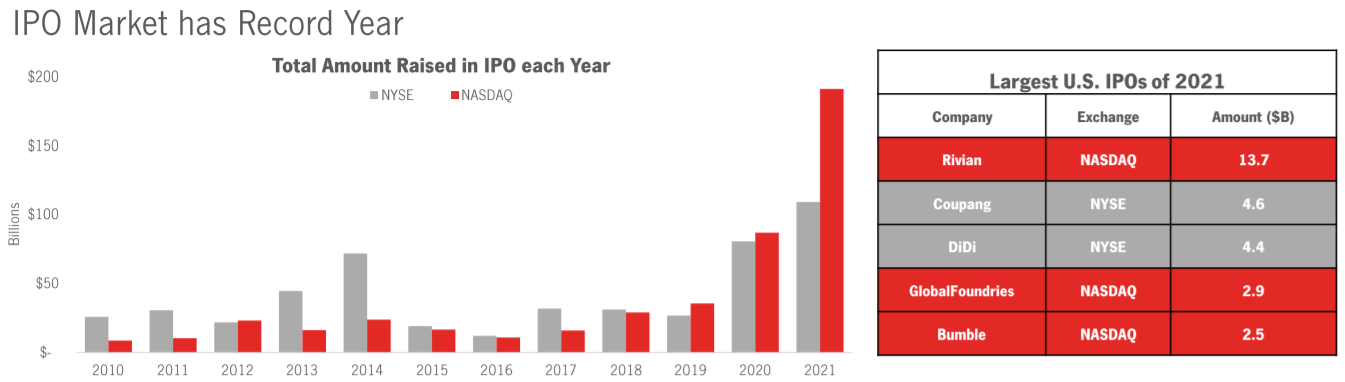
4: 2021 will always be remembered as the year investors wrote blank cheques for any tech company with a pulse
I believe that last chart and its conclusion has an affinity to the lead up to the dot-come bubble. Could you kindly explain chart 1. What is a account balance, a budget balance, and a twin deficit and what does this say about Canada, which seems in the middle.